
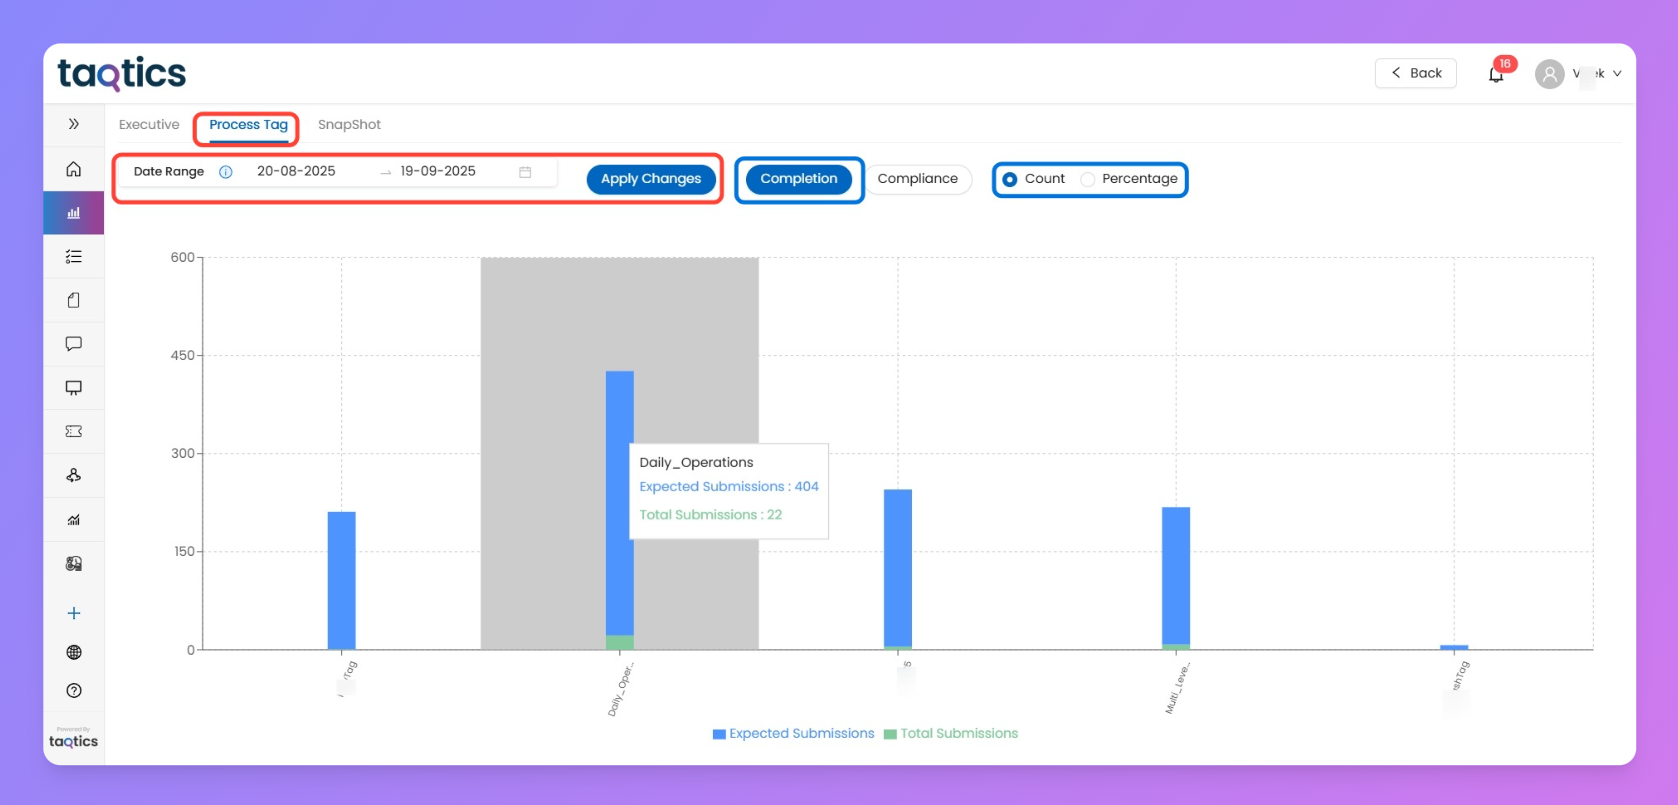
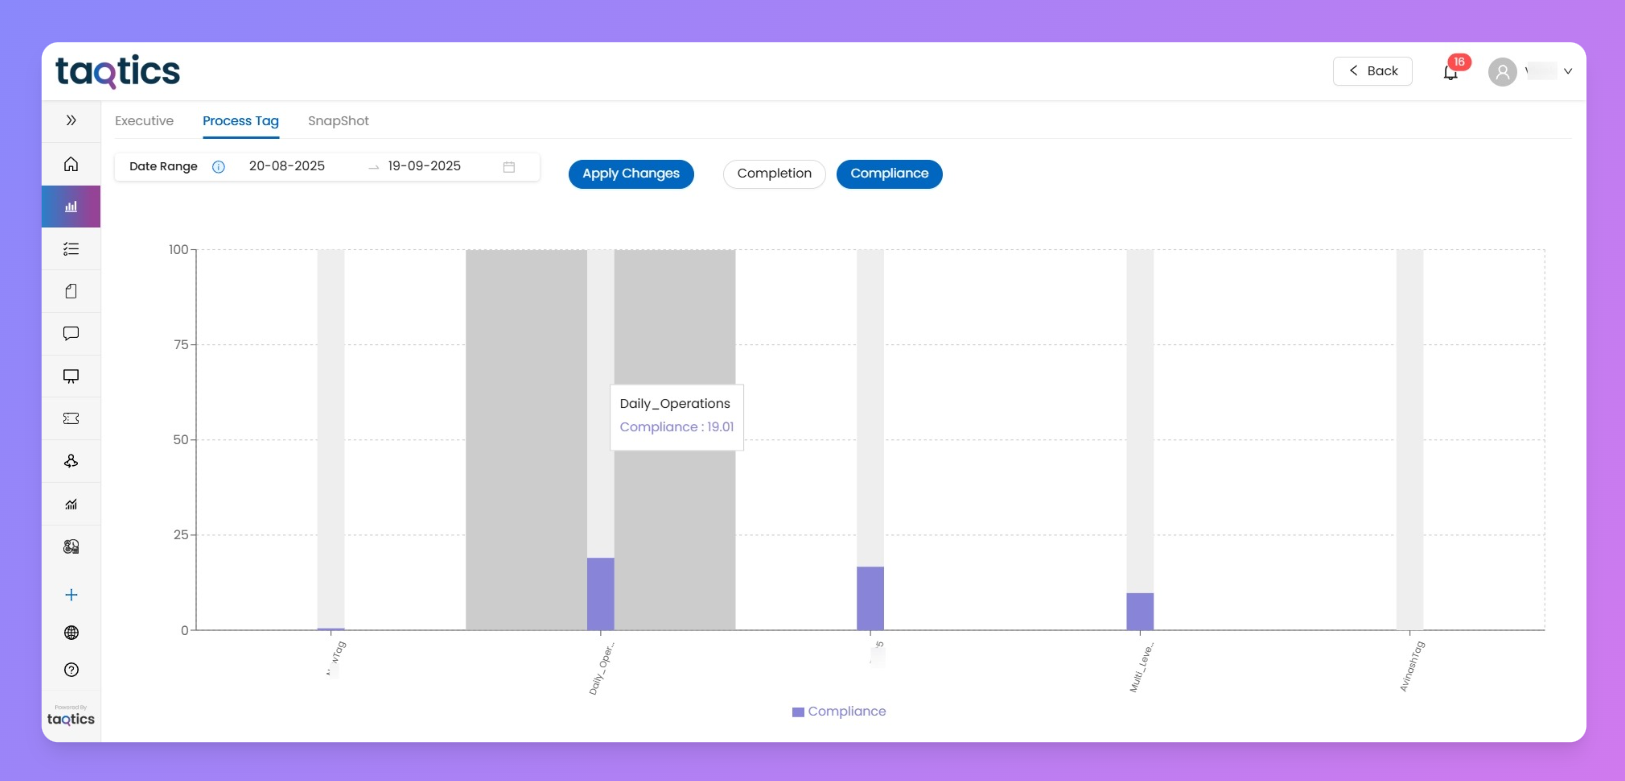
The Process Tag tab helps you analyze performance by tags you’ve configured (like Department, Brand, or Region). Each tag appears on the X-axis, with charts showing either completion or compliance.
What You’ll See
- Date Range Filter → Select the time period you want to review.
- Apply Changes → Refresh the chart with the selected date range.
- Completion View →
- Blue bar = Expected Submissions.
- Green bar = Total Submissions.
- Compare targets vs. actuals for each tag.
- Compliance View →
- Purple bar = Average compliance % per tag.
How to Use It
- Pick a date range from the filter.
- Click Apply Changes.
- Toggle between Completion or Compliance view.
- Review performance across tags — check where submissions are low or compliance is slipping.
⚡ Pro Tip: Use Process Tag when you want to compare performance across categories (like one region vs another), instead of store-by-store detail.