
The Snapshot tab gives you a daily heat map of process completion across all stores. It’s designed to quickly spot which stores are performing well and which need attention.
What You’ll See
- Date & Filters → Select a date, store, or process from the filters at the top.
- Heat Map →
- Y-axis = Store names.
- X-axis = Average % + each process name.
- Cells = Completion % for that store/process (green = completed, red = pending).
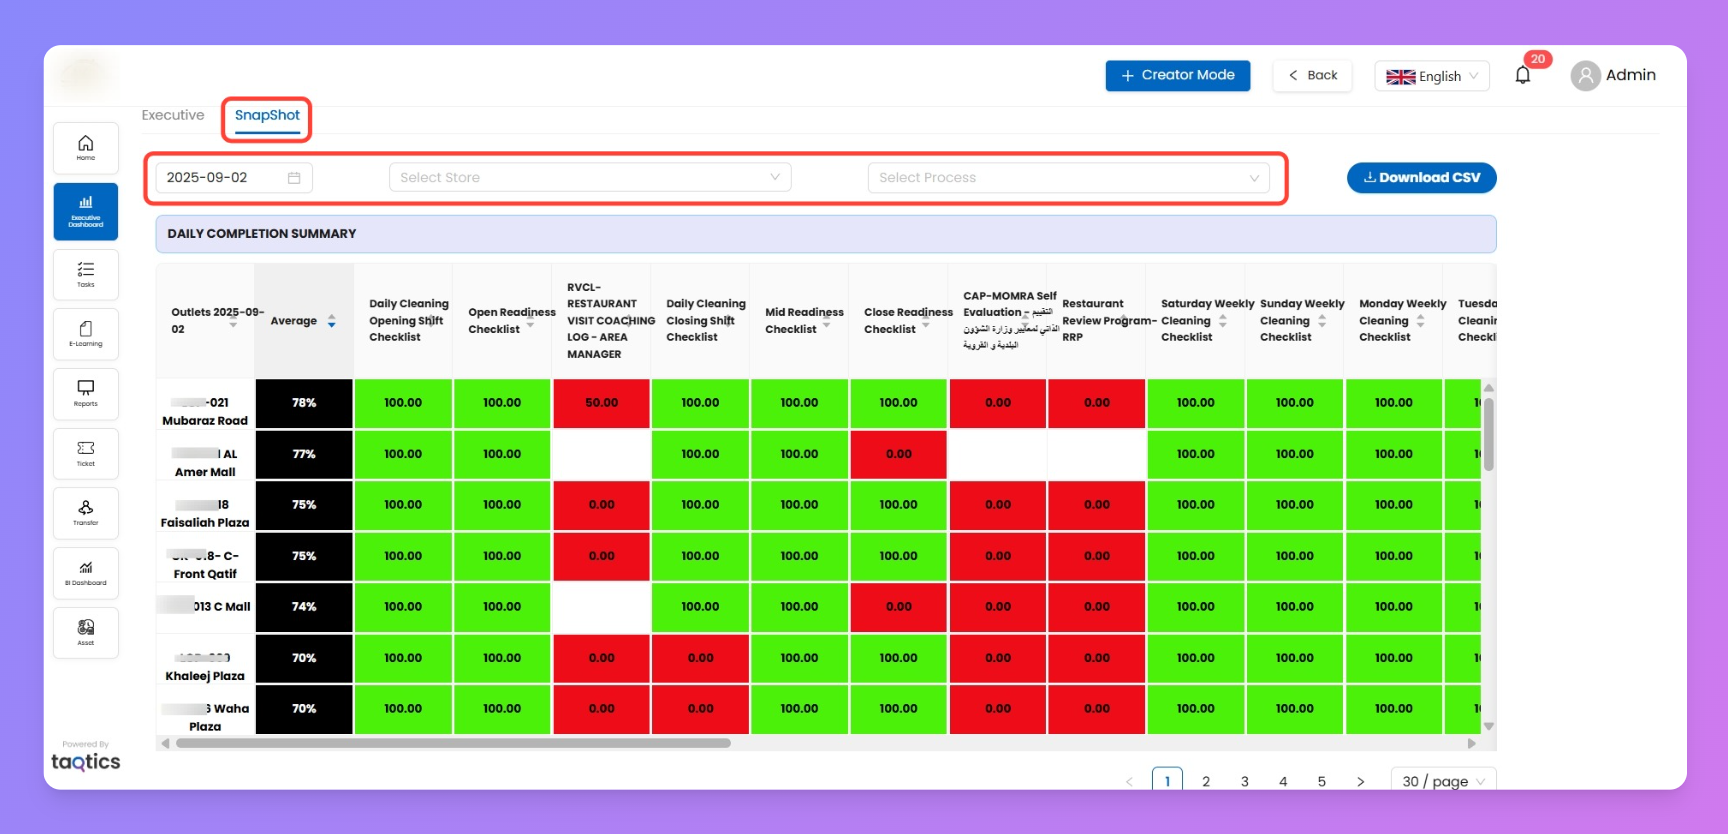
- Average Column → First column shows the overall average completion per store.
- Pagination → Navigate across pages to view all stores.
- Download CSV → Export the full heat map data.
How to Use It
- Pick a date and optionally filter by store or process.
- Review the heat map to identify stores with low completion.
- Use the average column to quickly rank stores by performance.
- Export data with Download CSV for further review.