
The Executive view gives you a high-level overview of store health and compliance. It’s built for leadership teams to track performance trends across the organization and then drill down into detailed store-level insights. From here, you can move from summary charts to granular heat maps, depending on the depth of analysis you need.
What you’ll find here:
- Org Summary: (high-level trends)
View consolidated bar charts showing overall store compliance and completion rates. See how your brand, areas, and managers are performing across different timeframes.
- Drill-Down Flow: (drill-down details)
Simply click any bar on the Org Summary chart to drill down into the detailed “All Stores” view. Here, you can compare individual store results, filter by custom tags (like Brand, Chain Manager, Area Manager), and check which locations need focus.
- Heat Map Chart: (granular view & source data)
Get an even more granular look with interactive heat maps. Track performance daily across every store, tag, or region—spotting consistency issues or top performers at a glance.
The heat map shows the data behind the bar charts and lets you investigate week-by-week or month-by-month trends.
Use the dashboard to filter by custom tags, analyze averages, and export data for further review. This makes it easy for you and other decision-makers to act on real results and drive your organization’s standards forward.
Continue with 👇
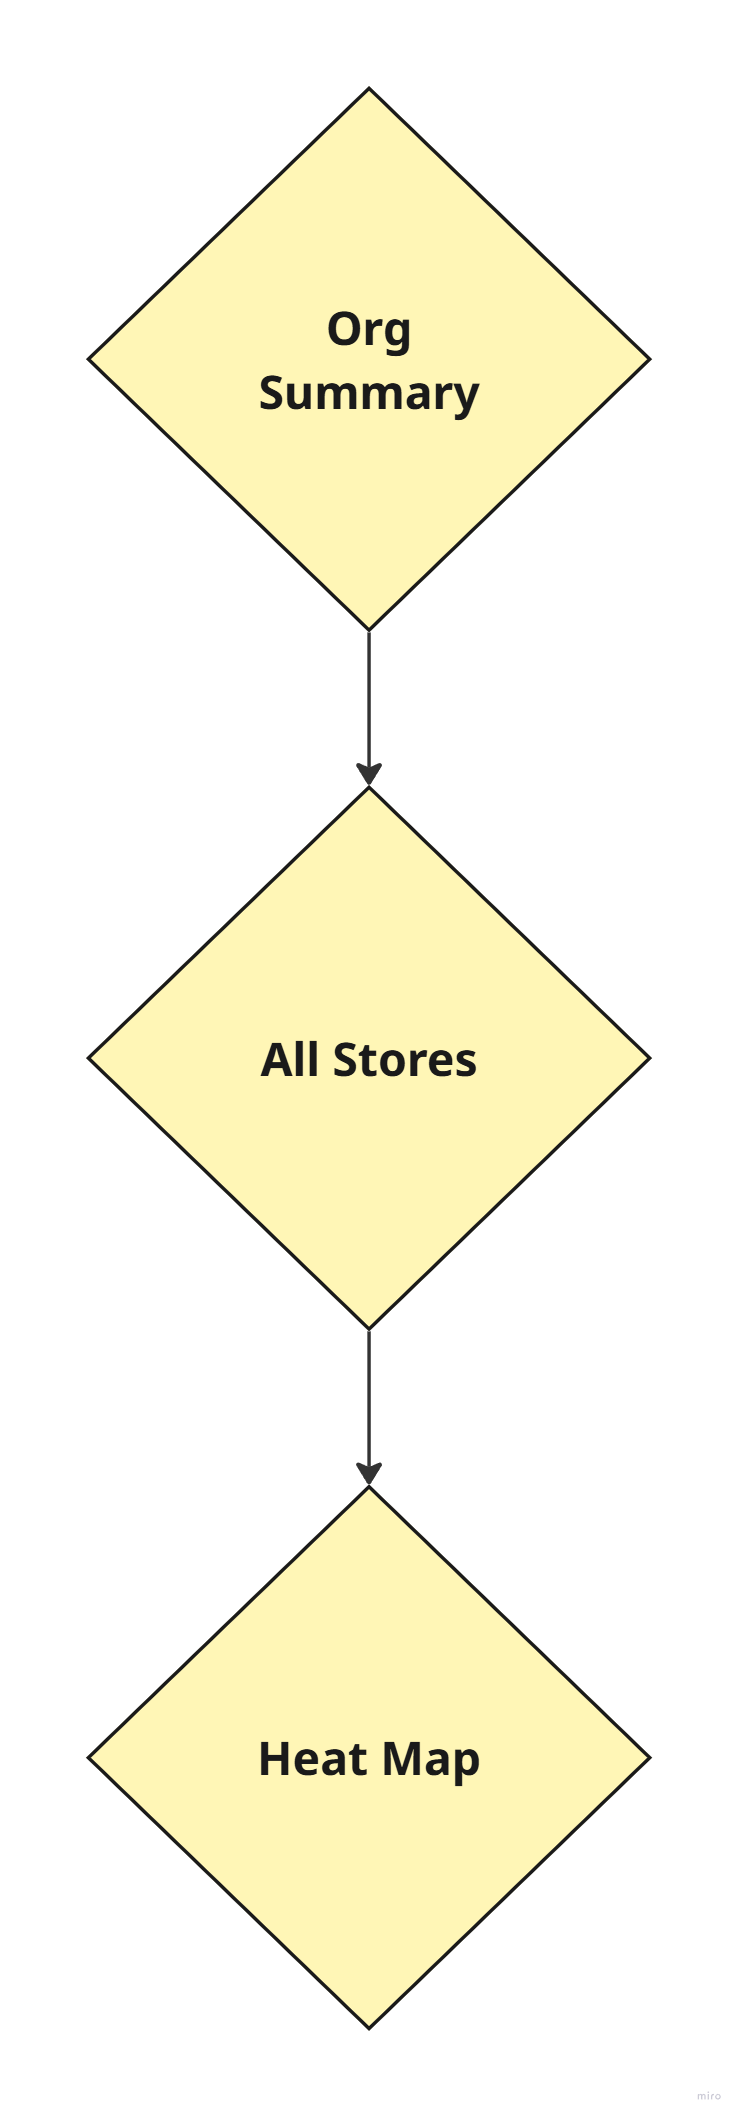
Org SummaryAll StoresHeat Map