
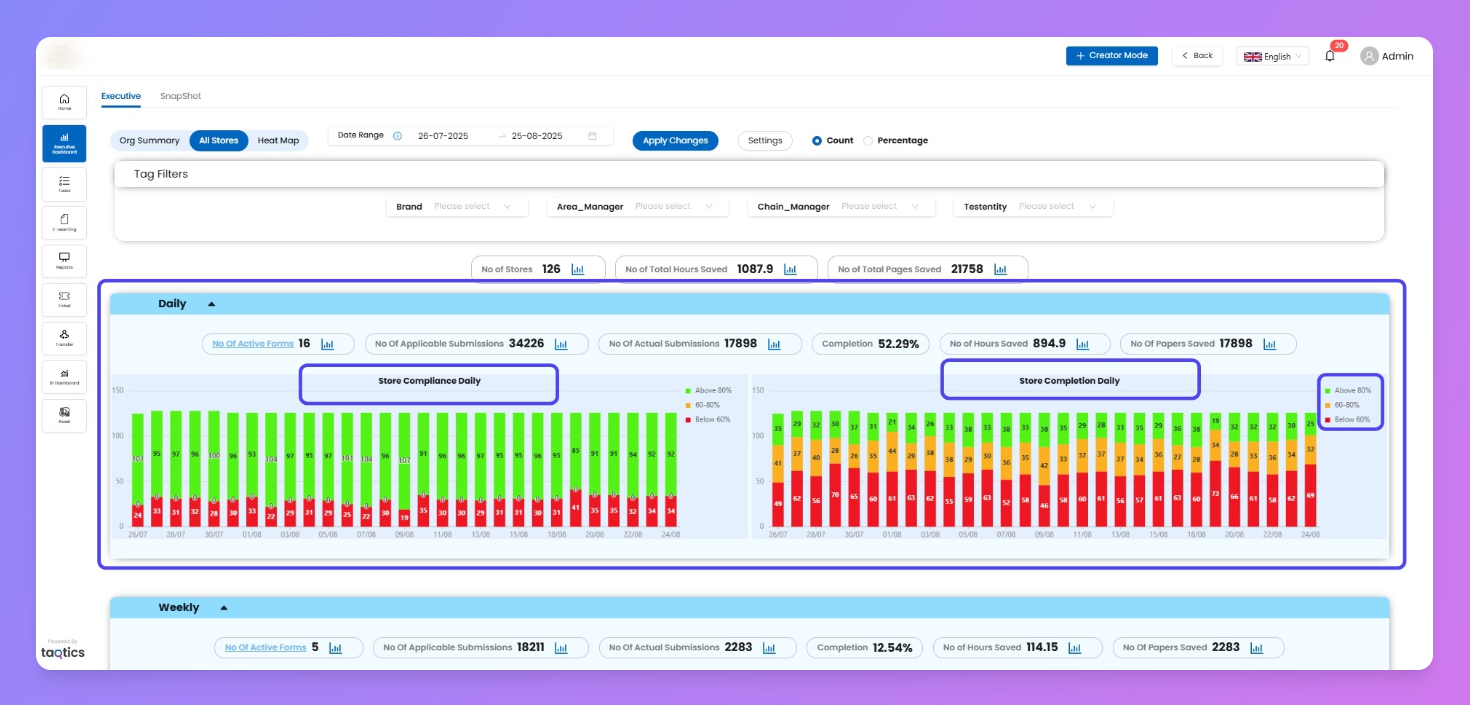
The All Stores page lets you deep-dive into performance across every store in your organization. Here, you can filter by tags, compare compliance and completion daily, and quickly spot trends or outliers. Managers and admins use this page for detailed analysis and operational tracking.
Filters
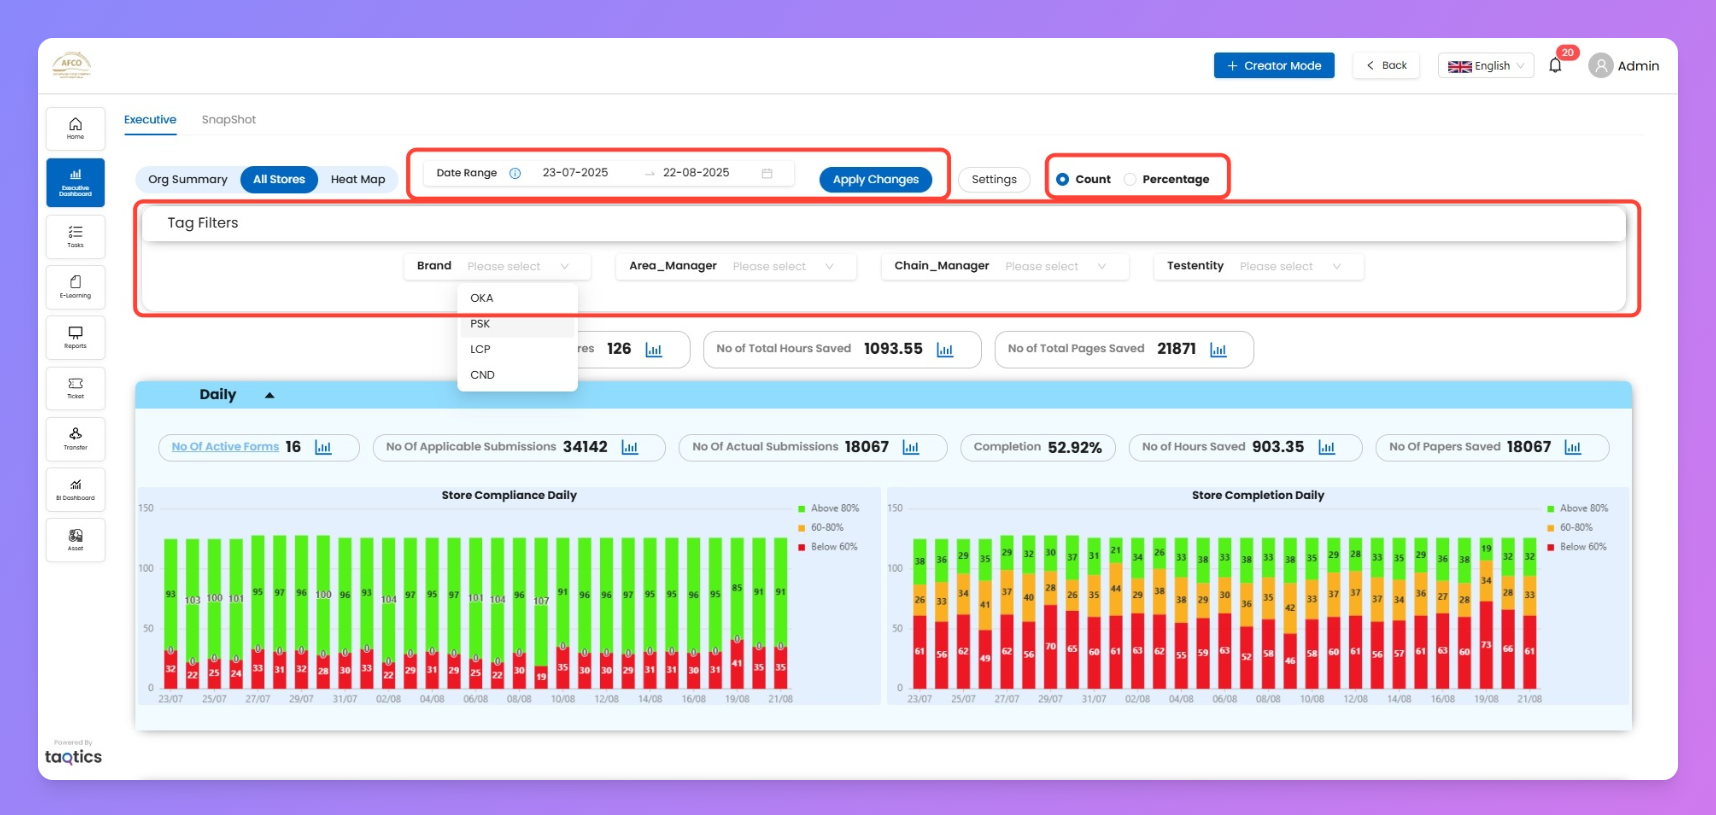
Use the powerful filter set at the top to customize your results:
- Date Range
Choose the range you want to analyze. (Tip: Keep it under 90 days for faster insights.)
- Tag Filters
Sort or segment data by tags like Brand, Area Manager, Chain Manager, or custom tags. Select a tag value (e.g., OKA, PSK, LCP, CND) to focus on specific store groups.
- Count / Percentage Toggle
Switch between viewing raw numbers or normalized percentages—whichever suits your analysis.
- Apply Changes
After setting filters, hit “Apply Changes” for instant results across every chart and metric.
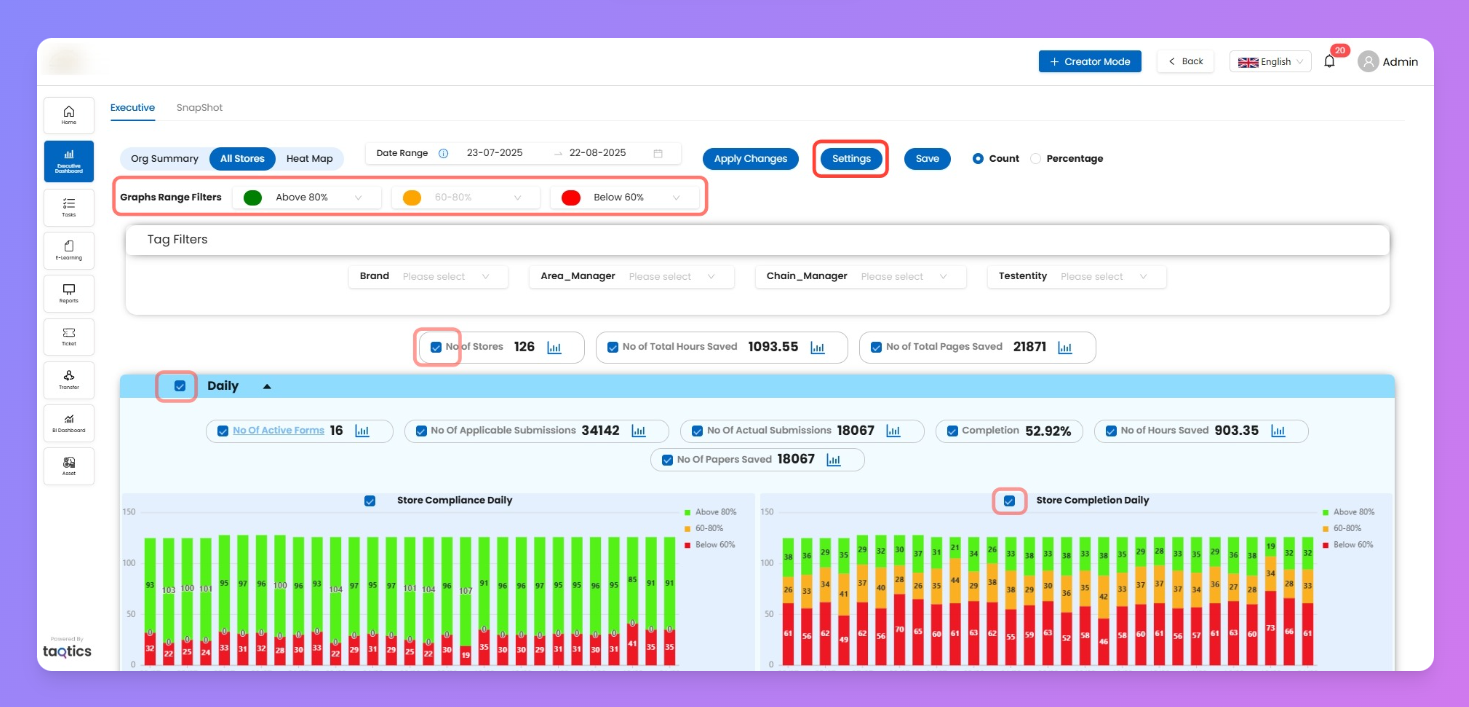
Adjust Your View (All Stores)
Use Settings to personalize what’s shown on the All Stores page without changing filter behavior.
- Show/Hide Sections
- Toggle visibility for Daily, Weekly, and Monthly sections or individual charts inside them to keep the layout focused.
- Graph Range Filters
- Set organization-wide thresholds for color bands used in charts:
- Green: Above threshold (e.g., >80%)
- Amber: Mid band (e.g., 60–80%)
- Red: Below threshold (e.g., <60%)
- Changes here update the legend ranges and color segmentation across all All Stores charts.
- Save & Exit
- Click Settings again to close. Your adjustments apply instantly across the All Stores page (sections, charts, and color bands).
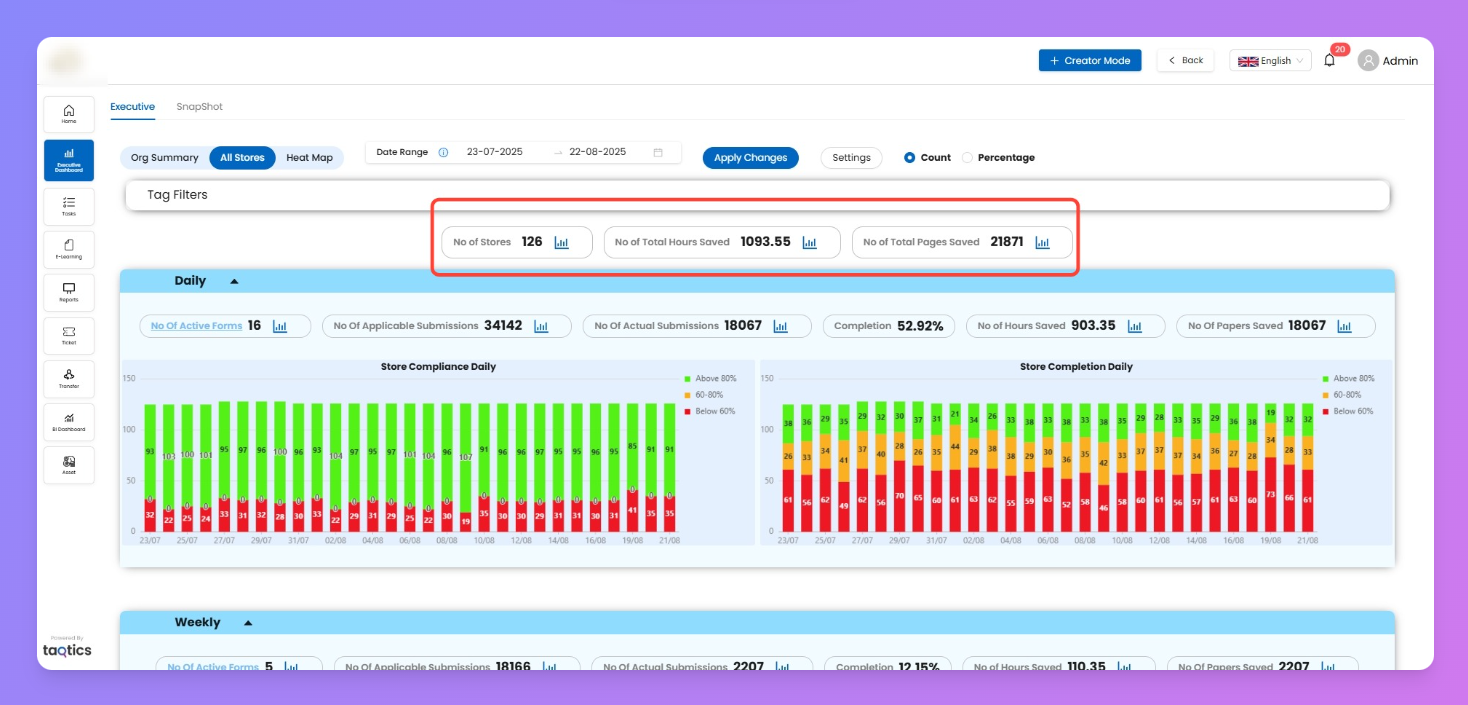
Meta Cards (Overview)
These KPIs summarize high-level activity for the current filters and date range, helping leadership gauge scale and impact at a glance.
Quick rollups that respect your filters (date range, tags, Count/Percentage).
Card | What it means |
No. of Stores | Total functional stores included in your current filters. |
Total Hours Saved | Estimates time saved by digitizing submissions. Assumption: 1 submission ≈ 3 minutes saved. Formula: Total Hours Saved = (Total Submissions × 3) ÷ 60.Example: 18,000 submissions → 900 hours saved. |
Total Pages Saved | Estimates paper saved by replacing manual pages with digital submissions. Default: 1 submission = 1 page. Customization: Can be configured in process properties (e.g., 1 form = 3 pages).Formula: Total Pages Saved = Total Submissions × Pages per Submission. |
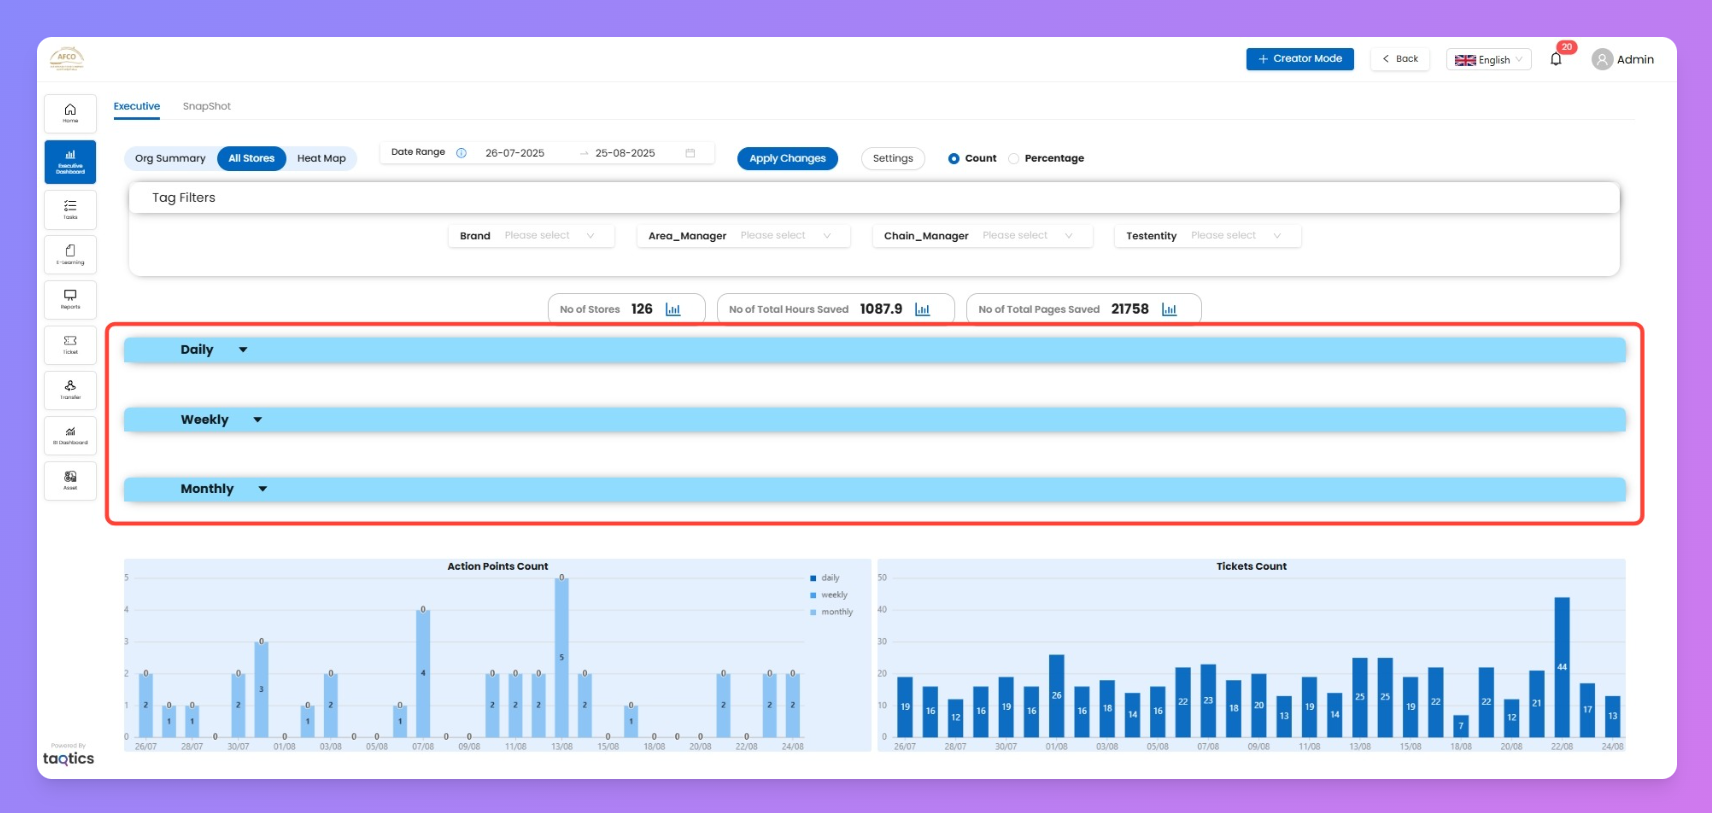
All Stores View
Shows how every store is performing, grouped by process periodicity: Daily, Weekly, Monthly.
Unlike Org Summary (tag-level aggregation), this page puts Period on the X-axis and shows how many stores fall into each performance band for each time bucket. Click any bar to drill straight into the Heat Map for the exact breakdown.
Periodicities (how data is split)
Each section only includes forms scheduled at that periodicity. One process appears in one section only.
Periodicity | What shows up |
Daily | Only daily-scheduled processes. |
Weekly | Only weekly-scheduled processes. |
Monthly | Only monthly-scheduled processes. |
KPI Grid (common inside each periodicity panel)
KPI | Description |
No. of Active Forms | Forms scheduled for this periodicity and active within selected filters. |
No. of Applicable Submissions | Expected runs (assignments/schedules) for these forms. |
No. of Actual Submissions | Submissions actually received. |
Completion % | Actual ÷ Applicable submissions (quick execution health). |
No. of Hours Saved | Time saved from digital runs (uses minutes-per-submission setting). |
No. of Papers Saved | Paper saved (uses pages-per-submission setting). |
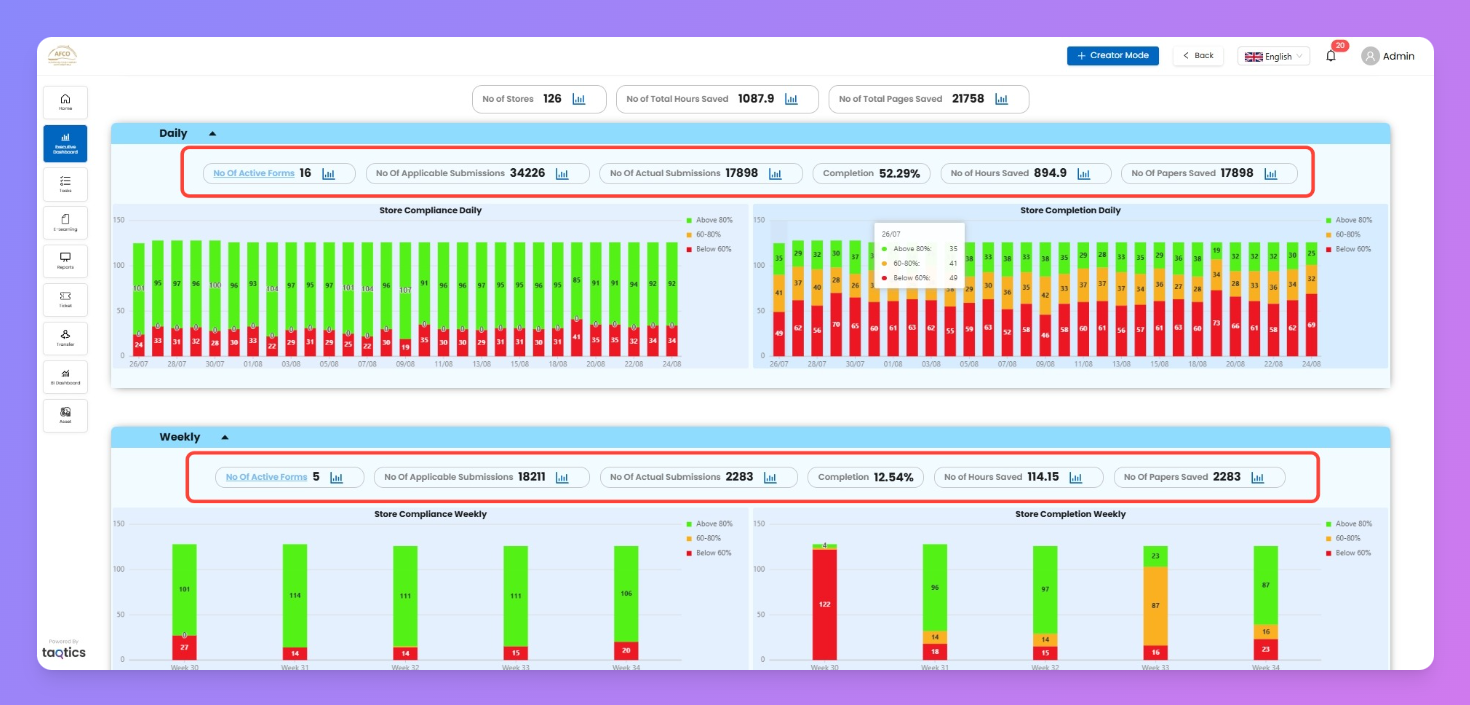
Charts (per periodicity) — what a bar means
Both charts are stacked bars with the same banding. The Y-axis is always a count of stores; the X-axis is the time bucket for that periodicity.
Chart | X-axis (time) | Y-axis | What a bar represents |
Store Compliance (left) | Daily: Date • Weekly: Week • Monthly: Month | Count of functional stores | For that time bucket, how many stores were >80%, 60–80%, <60% compliant. |
Store Completion (right) | Daily: Date • Weekly: Week • Monthly: Month | Count of functional stores | For that time bucket, how many stores hit >80%, 60–80%, <60% completion versus expected runs. |
Band colors (configurable in Settings):
- Green: Above 80% • Amber: 60–80% • Red: Below 60%
Use chart legends to hide/show bands for quick focus.
How to read a bar (example)
Pick 25/08/2025 in the Daily section → the bar shows the distribution of your functional stores that day: how many were >80%, 60–80%, <60% (for Compliance or Completion, depending on the chart).
Drill-down Flow (All Stores → Heat Map)
Drill-Down Flow
plain textAll Stores (Executive Dashboard)
│
├── Select Process periodicity (Daily / Weekly / Monthly)
│     ├── KPI (Active Forms, Submissions, Completion, Hours, Papers)
│     └── Open Charts (Compliance or Completion)
│
└── Click any bar of bar stack chart (of any periodicity date/week/month)
       ↓
       Heat Map (of selected time bucket × Stores, detailed breakdown)
             → see exactly which stores passed/lagged
Tips & Best Practices
- Use legends to declutter → Toggle Above 80%, 60–80%, or Below 60% to isolate problem areas or celebrate strong performers.
- Customize thresholds once → Settings panel updates compliance/completion bands.
- Drill smartly → Always move from overview (All Stores) → detail (Heat Map) → root cause (store submissions/tickets).