
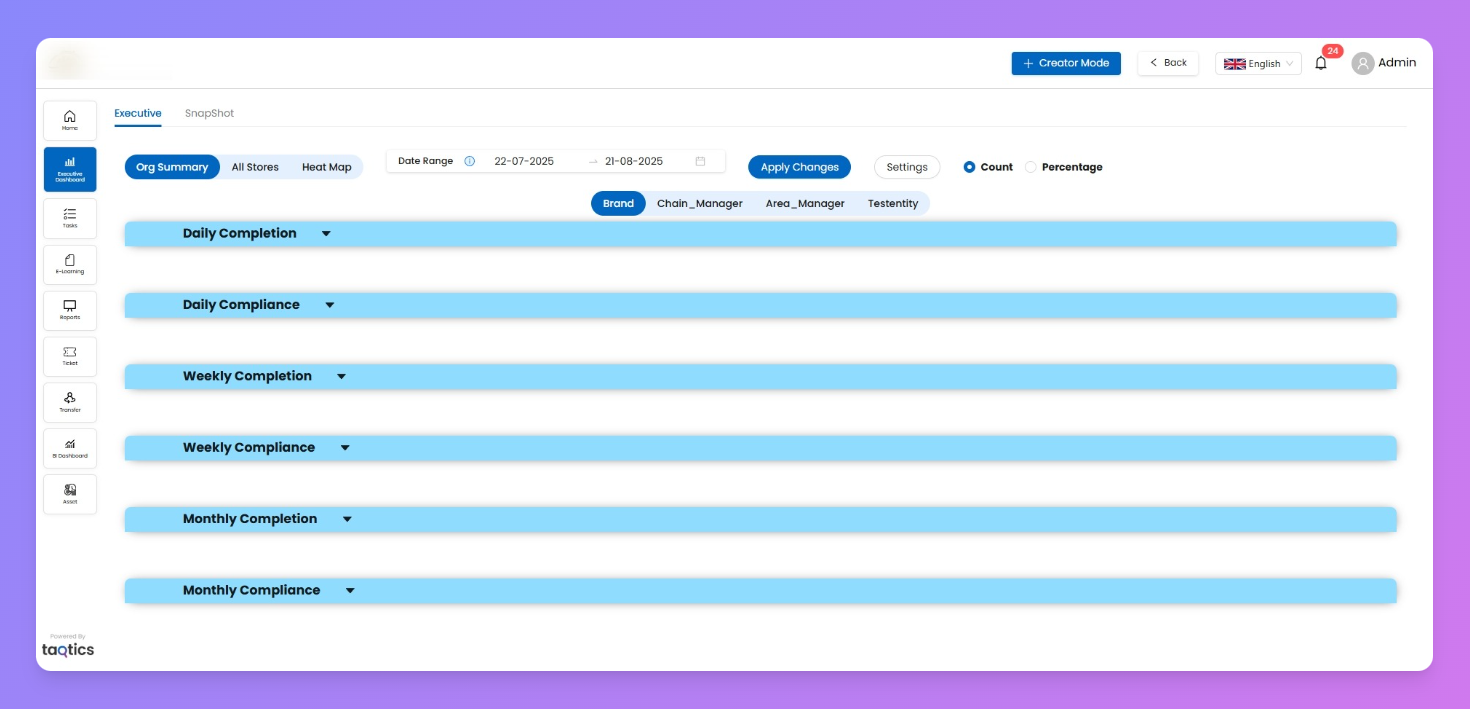
The Org Summary page gives executives and managers a high-level view of store performance. It shows daily, weekly, and monthly completion and compliance data segmented by store tags, helping leadership identify trends, compliance gaps, and improvement areas.
Here, you can quickly view summary charts for
Metric | What it Shows |
Daily Completion | % or count of tasks/processes completed each day across stores. |
Daily Compliance | % or count of audited items meeting standards daily. |
Weekly Completion | Aggregated completion % or counts for weekly periods. |
Weekly Compliance | Weekly aggregation of stores meeting compliance benchmarks. |
Monthly Completion | Monthly summary of task/process completion performance. |
Monthly Compliance | Monthly summary of audit and compliance success rates. |
Use custom filters and Store tags to segment your results and focus on what matters most.
Drill down into the bar charts to analyze store-level details or explore the full breakdown behind each metric—all from a single, interactive view. This makes organization-wide monitoring and action easy and effective.
Filters
The Org Summary page gives you flexible control to customize your performance view:
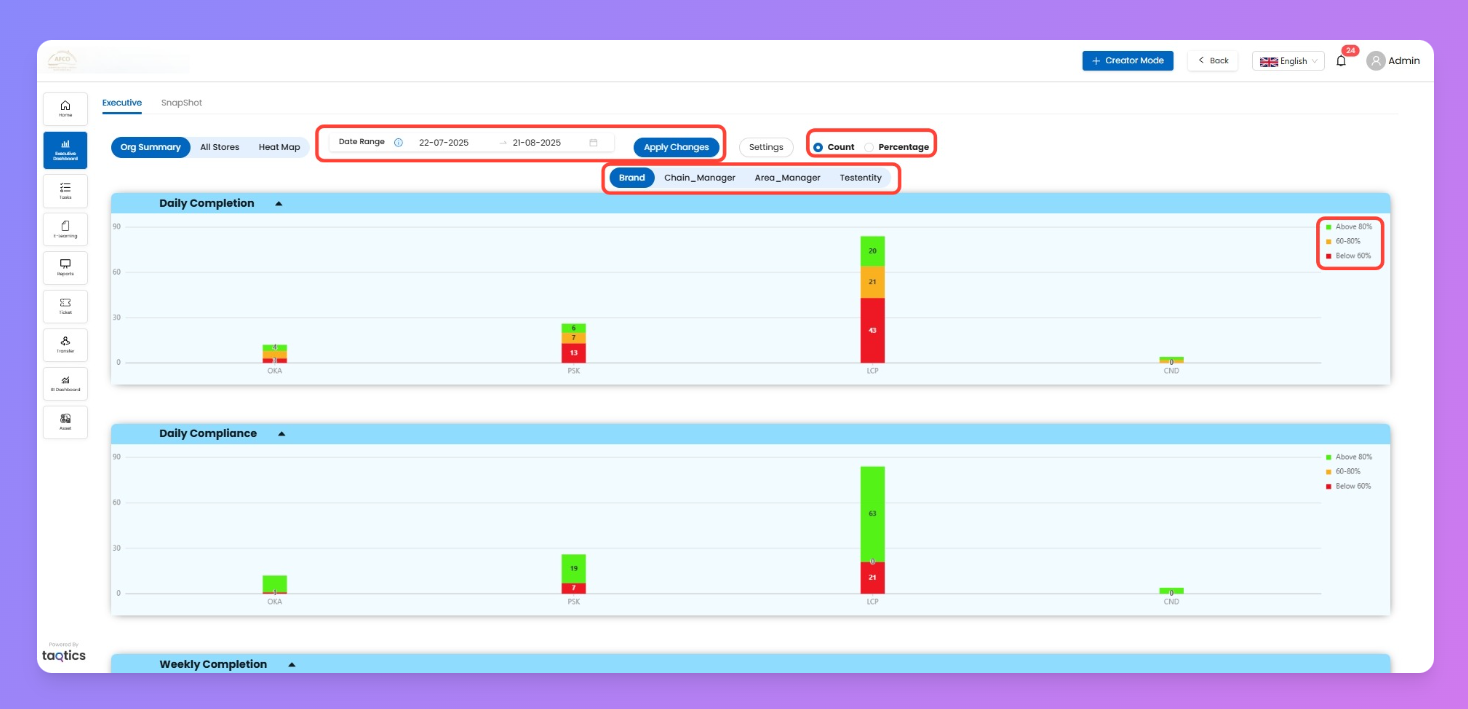
Date Range
- Select any start and end date to analyze store performance over a specific period.
- Easily compare trends week over week, month over month, or for any custom timeframe.
Date Range should be under 90 Days
Tag Filters
- Filter your results using organizational tags like Brand, Chain Manager, Area Manager etc
- These tags help you focus on specific groups, teams, or business segments—drilling down to what matters most.
Metric Type: Count vs. Percentage
- Choose between viewing raw counts or percentage scores.
- Count: See actual numbers for completions or compliance.
- Percentage: View normalized scores to compare across different stores or segments.
Toggle Legends
- Click any legend on the right of a chart (like Above 80%, 60–80%, Below 60%) to show or hide its data. Use this for instant, live filtering of your performance charts.
Any changes you make to these filters will instantly update all charts on this page—Your selections apply across the full dashboard for consistent, real-time insights.
Adjust Your View
The Settings button in the Executive Dashboard lets you personalize your Org Summary view. Open it to choose which charts to see, set performance ranges, and reorder store tags—so the dashboard matches your business focus.
How it works:
- Open Settings
Click Settings on the dashboard to enter customization mode.
- Show/Hide Charts
Tick or untick charts (e.g., Weekly Completion, Weekly Compliance) to keep only the ones you care about.
- Set Graph Ranges
Define performance bands (e.g., >80%, 60–80%, <60%) to match your org’s standards. These bands apply across all charts.
- Reorder Store Tags
Drag and arrange tags like Brand, Chain Manager, or Area Manager in the order you want reports to appear.
- Save & Exit
Click Settings again to close. Your preferences are saved, and the dashboard updates instantly.
Understanding Bar Charts
How to read and interpret the charts:
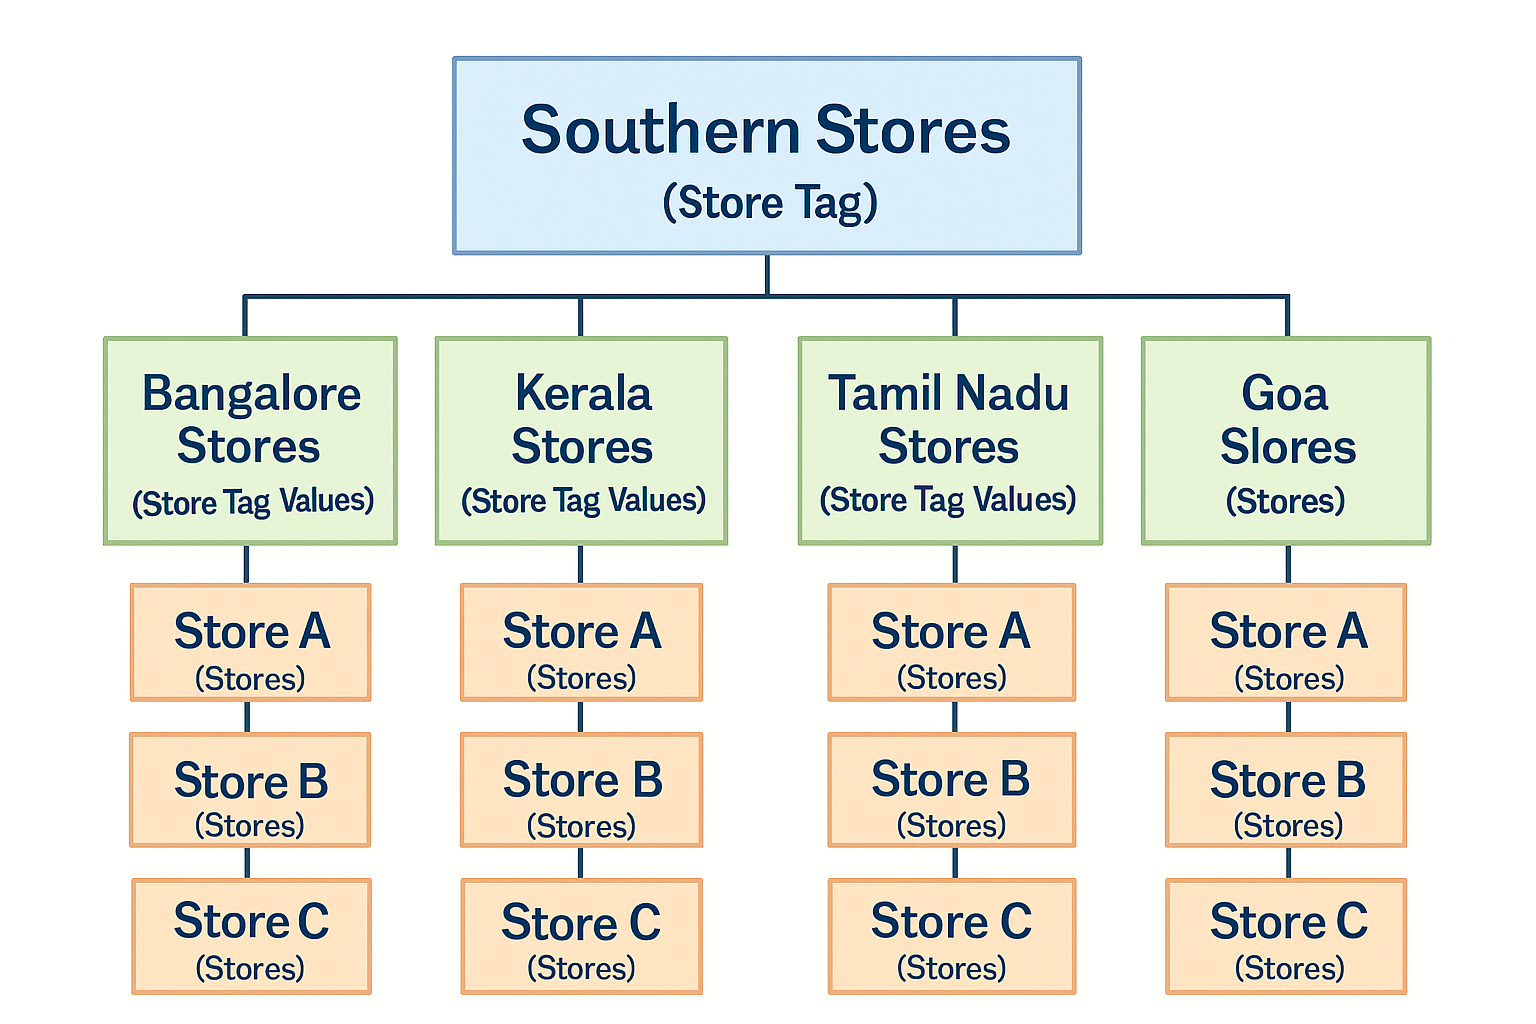
Each chart groups performance by the selected Store Tag.
The X-axis shows the tag values (e.g., Bangalore stores, Goa Stores), and each bar’s height reflects the average completion or compliance for stores in that group.
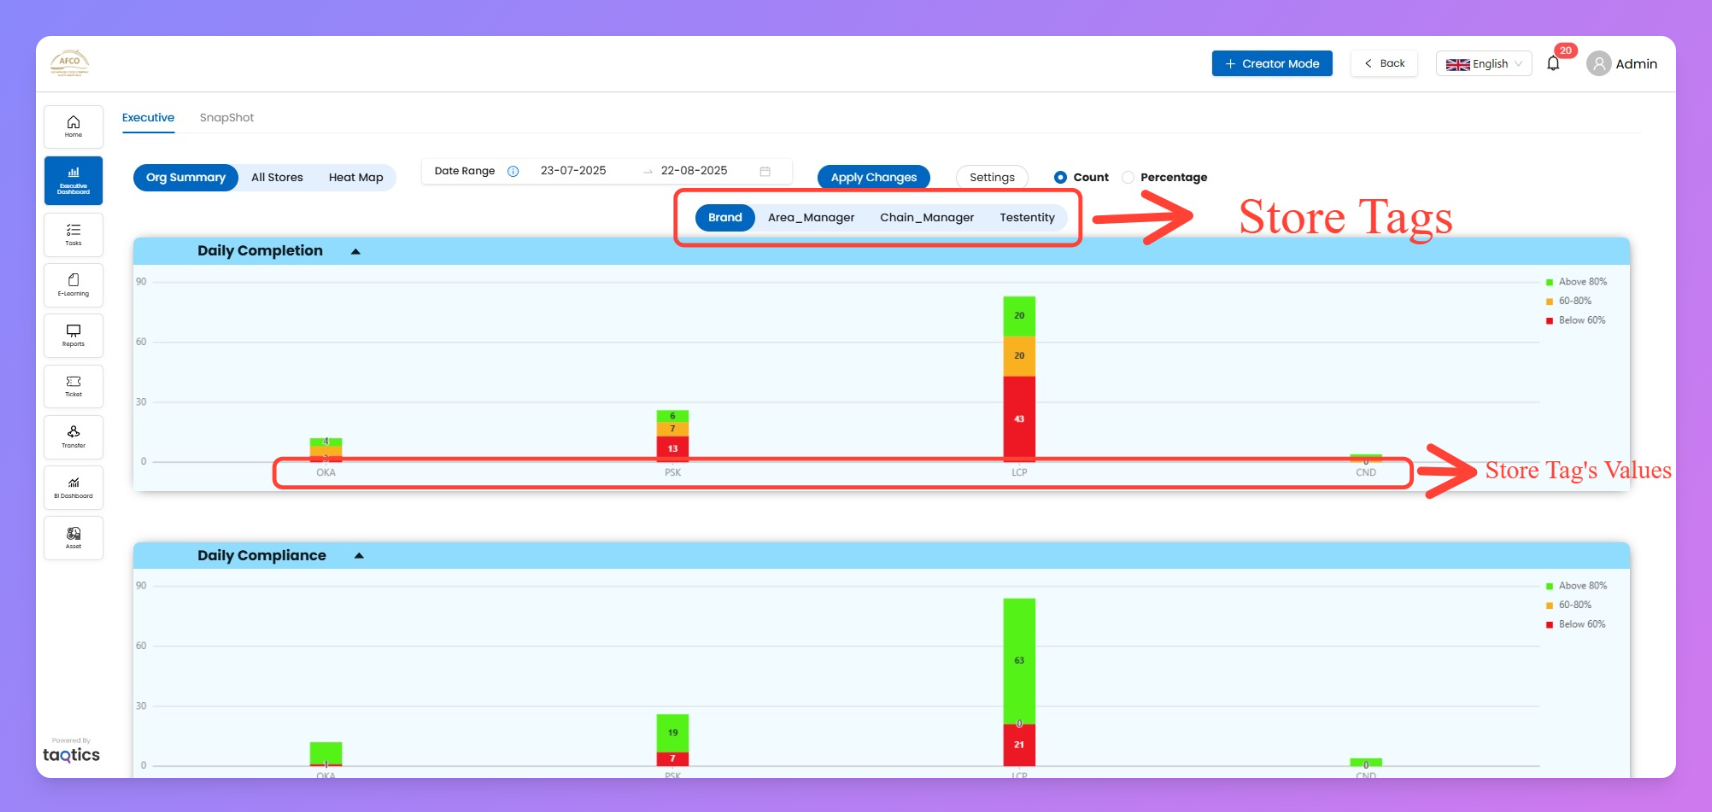
plain textEach chart → grouped by selected Store Tag
        ↓
Bars represent Store Tag Values (e.g., Brand = OKA, PSK, LCP)
        ↓
Bar height = avg completion/compliance for all stores in that tag value
        ↓
Color bands = performance thresholds
   - Green → >80%
   - Amber → 60–80%
   - Red → <60%
        ↓
Toggle legends = hide/show specific performance bands for cleaner insights
Drill-Down Navigation
Charts support drill-down so you can move from high-level metrics → store-level detail:
plain textStore Tag Filters (top of page)
        ↓
Select Store Tag (e.g., Brand, Area Manager, Chain Manager)
        ↓
X-axis updates with Store Tag Values (e.g., OKA, PSK, LCP)
        ↓
Each bar = grouped stores under that tag value
        ↓
Bar height = avg completion/compliance for the group
        ↓
Click a bar → All Stores View
        ↓
See individual store performance
        ↓
Click a store → detailed heat maps , submission reports, tickets
Tips & Best Practices
- Use Store Tag Filters to compare dimensions like Brand, Area Manager, or Chain Manager.
- Switch between Count vs Completion % mode depending on your analysis.
- Use Legends to highlight specific performance ranges quickly.
- Share insights with teams regularly to drive alignment and corrective action.