Track how a single process/audit is performing across all assigned stores: who’s assigned, who submitted, compliance/completion trends, and any action points.
Page header (controls)
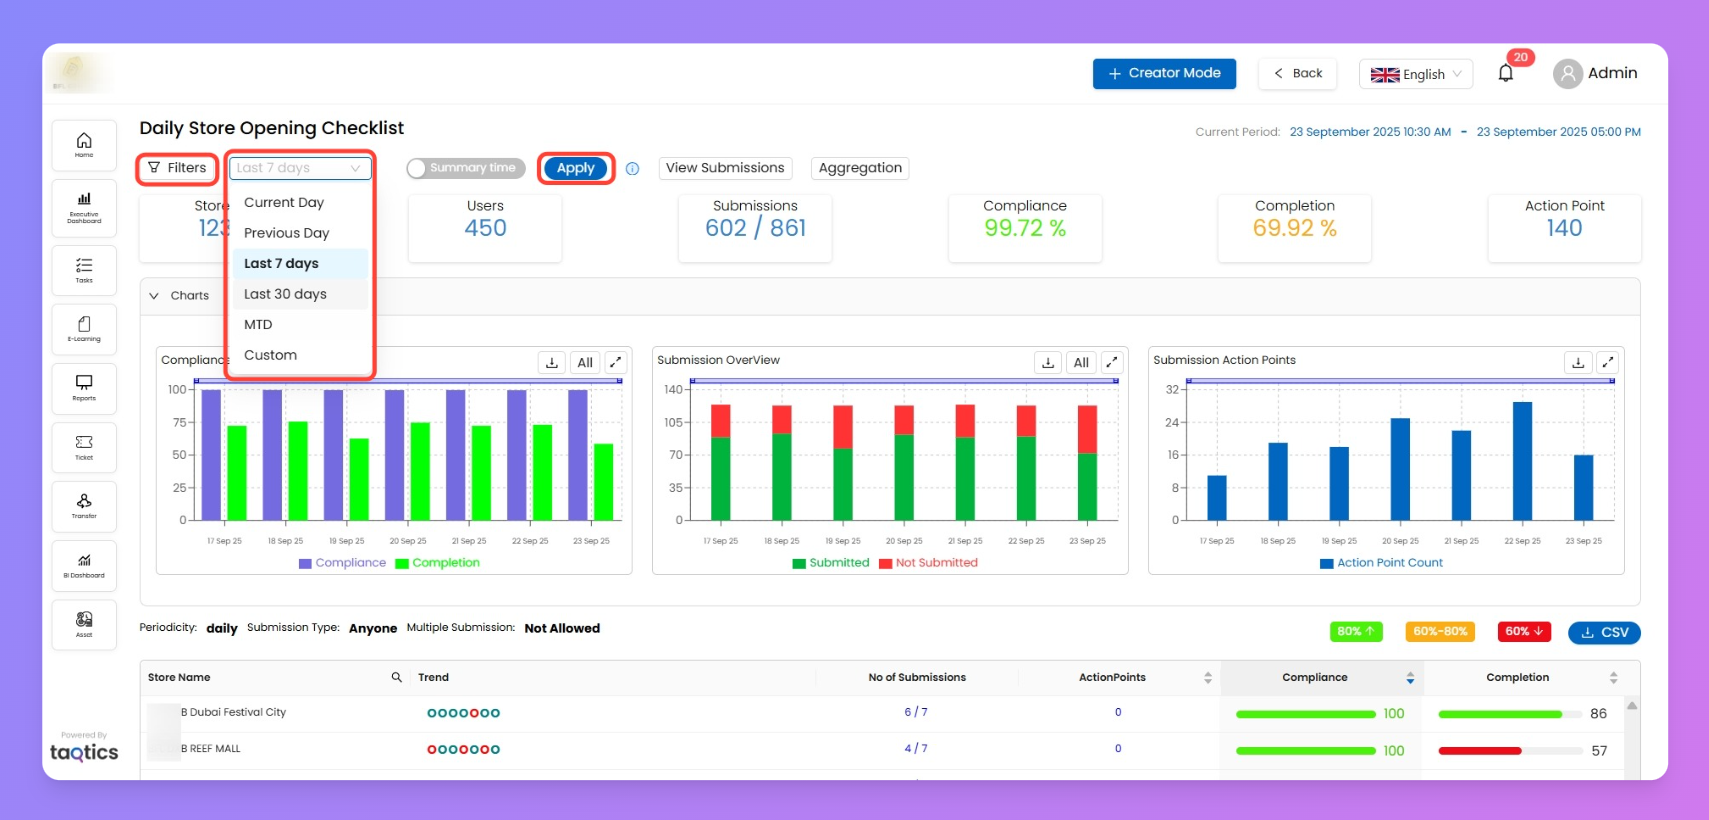
Filters→ opens side panel to narrow the view before running numbers.
Period granularity- According to the process periodicity, you’ll have different filters
Daily: Current Day/ Previous Day/ Last 7 days / Last 30 day/ Month to Date /Custom
Weekly: Current week / Previous week / Last 7 weeks / Custom
Monthly: Current month / Previous month / Last 3 months / Custom
Period picker → context-aware (Daily/Weekly/Monthly) quick ranges + Custom.
Apply → re-runs the page with your filters/period.
A Process of “Daily Store Opening Checklist” with Daily periodicity
View Submissions → opens the complete submissions list (modal).
Aggregation → shows the page in aggregated mode for the chosen scope (same filters/period).
Current Period (top-right) → shows the exact start/end window of the process being analyzed.
Filters (side panel)
Refine exactly what appears on the page (and in all charts/KPIs/tables).
Store Tags
Brand, Chain_Manager, Area_Manager (multi-select)
Select Common Entities (helper)
Show Tag Based Stores (preview the matching stores)
Selected Stores (explicit include/exclude list)
Submitted By (user filter)
Apply filters, then use the Apply button in the header to refresh KPIs, charts, and the table.
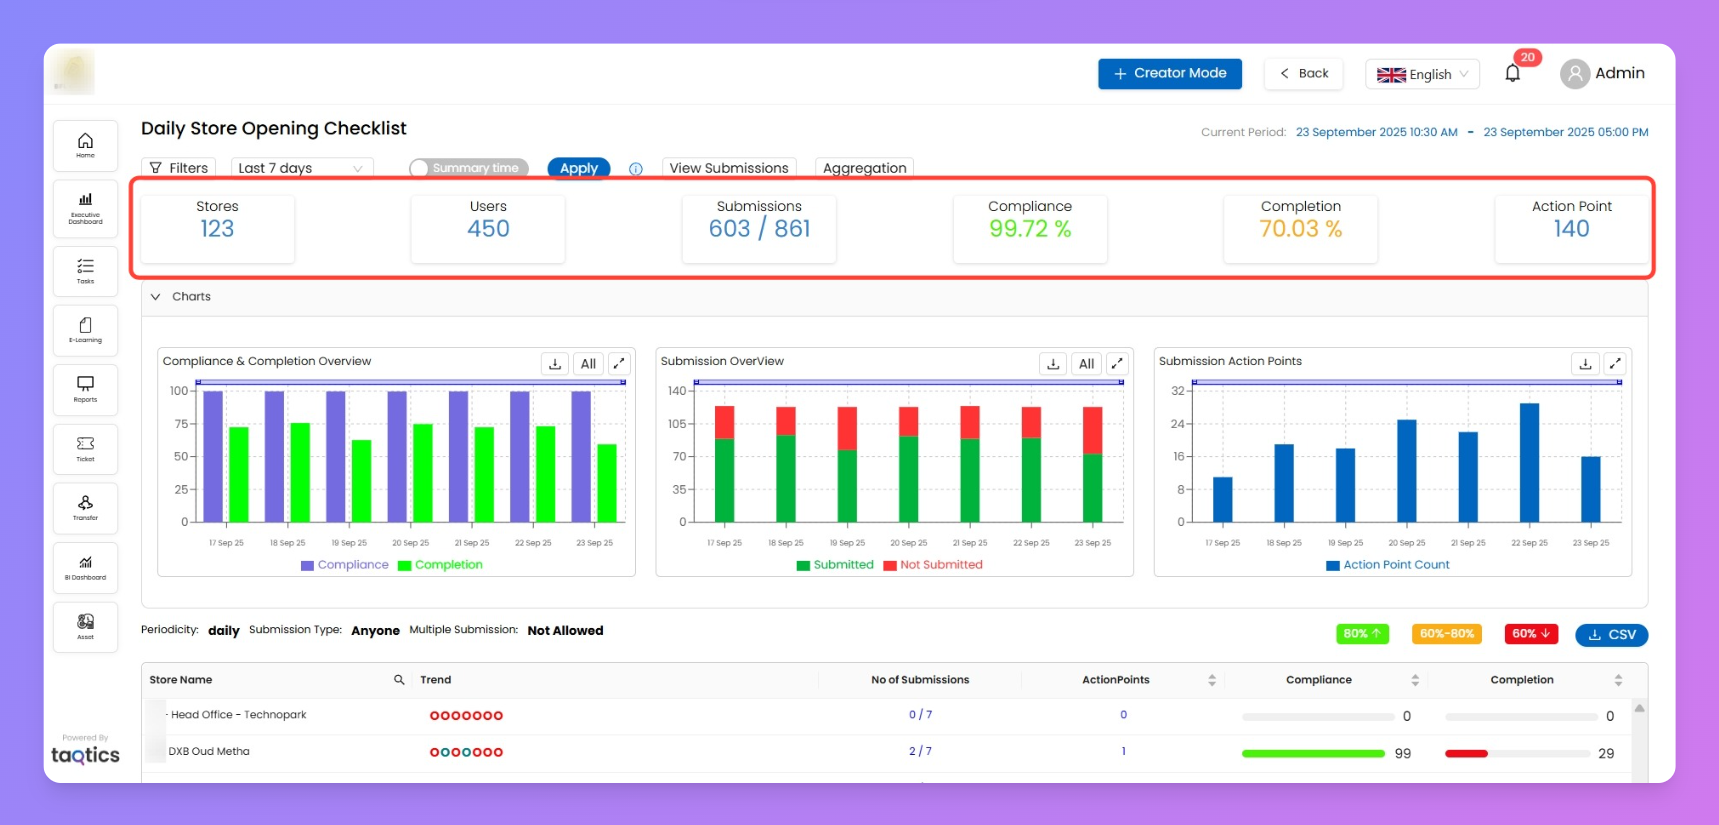
KPI cards (what they show & what’s clickable)
Only the KPIs marked ✅ below are interactive; the rest are just summary tiles.
Stores – total stores in-scope .
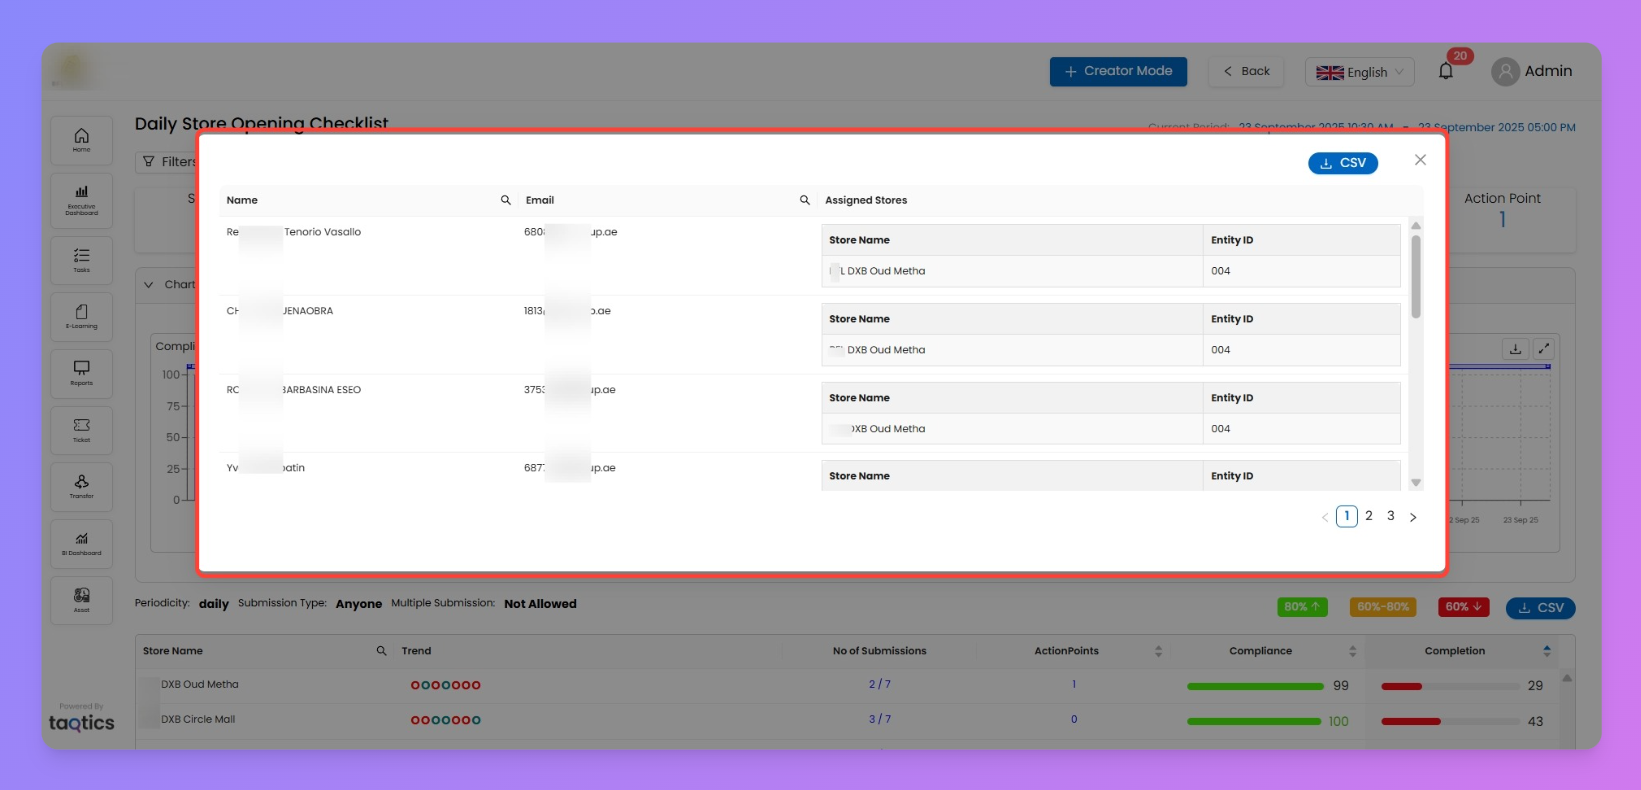
✅ Users – total assignees in-scope. Click to open Users modal (search, pagination, CSV).
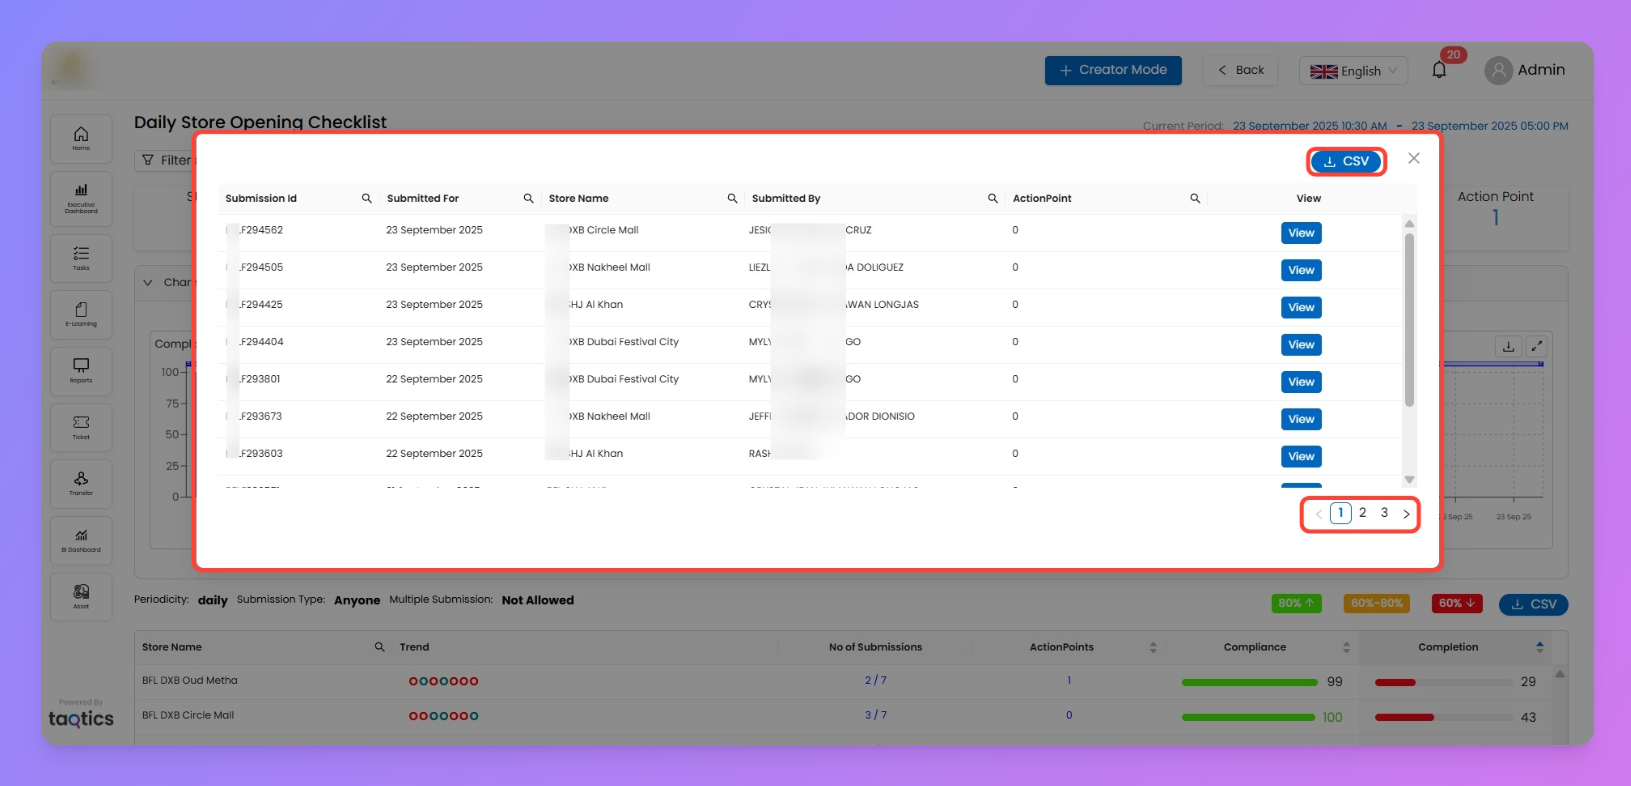
✅ Submissions (X / Y) – submitted vs expected. Click to open Submissions modal (search, pagination, “View” each submission, CSV).
Compliance % – average compliance for the period .
Completion % – average completion for the period .
✅ Action Point – count in the period. Click to jump to the Action Point report for this process.
The Users and Submissions modals are also reachable via View Submissions (same list as clicking the Submissions KPI).
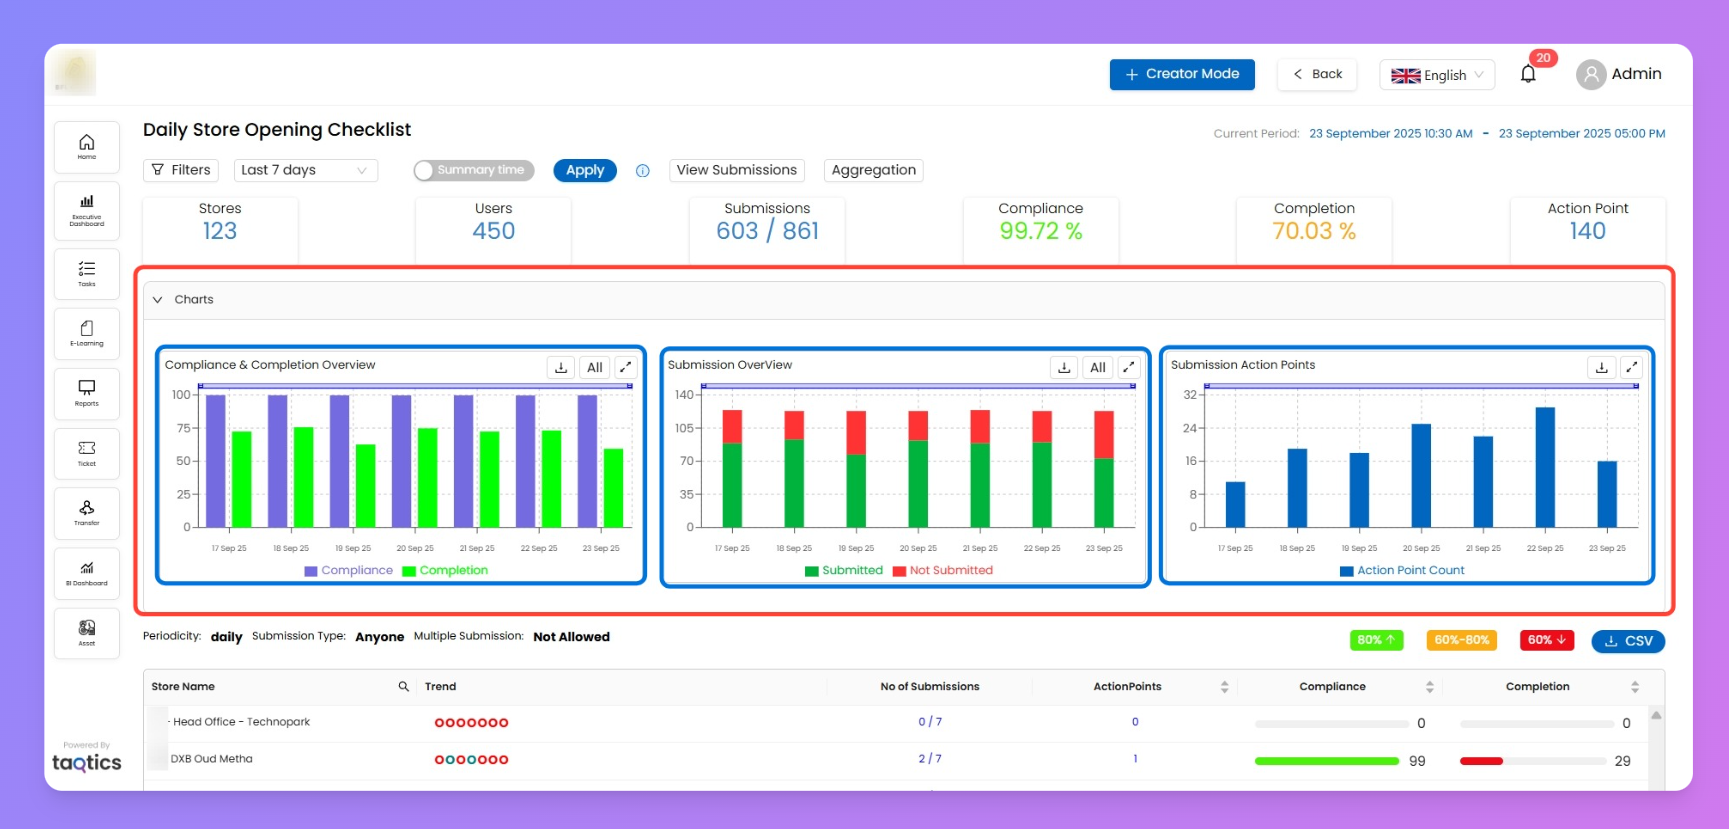
Charts (top section)
Three standard widgets help you spot patterns quickly. Each chart supports:
Enlarge (double-arrow icon)
Download CSV (source data for the chart)
Charts shown:
Compliance & Completion Overview – side-by-side bars of average Compliance vs Completion per period bucket.
Submission Overview – green (Submitted) vs red (Not Submitted) counts per bucket.
Submission Action Points – action point counts over time.
Store table (bottom section)
A store-wise performance grid for the current filters/period.
Columns
Store Name
Trend (timeline dots) → each dot = one scheduled bucket (e.g., a week for weekly processes).
Green dot = submissions exist in that bucket.
Red dot = no submission in that bucket.
Click any dot → opens the Submissions modal pre-filtered to that time slice.
No of Submissions (x / y) → clickable to open the Submissions modal for that store & period.
Action Points – count for the store (click the KPI at the top to drill to the report).
Compliance – colored bar (driven by your global green/amber/red thresholds).
Completion – colored bar (same thresholds).
Table tools
Search, pagination, and a CSV export for the grid.
Notes & tips
The colored bars for Compliance/Completion use your org’s heat-map thresholds (same configuration reflected elsewhere).
Use trend dots to zero in on gaps fast; a red dot indicates a missed bucket—click it to see who didn’t submit.
Need action-point detail? Use the Action Point KPI to jump straight to the dedicated report for this process.