
Org Report
The Org Report gives you an organization-level data dump of all process and audits created in the system. This is where higher-level roles can see every form in one place, track its activity, and export plain text data for deeper analysis.
Main Grid
- Columns include:
- Form ID
- Title
- Form Type (Scoring (Process) / Audit )
- Priority (set in your process or audits)
- Users (assigned count)
- Stores (assigned count)
- Periodicity (frequency Daily, Weekly, One-time, etc.)
- Status (Active / Inactive → based on whether the checklist is currently fillable based on it’s start and end time)
Controls
- Show Stats → Adds two extra columns:
- Completed – total submissions in last 90 days
- In Progress – submissions currently ongoing (last 90 days only)
- Callout: Completed/In Progress reflects 90 days status only.
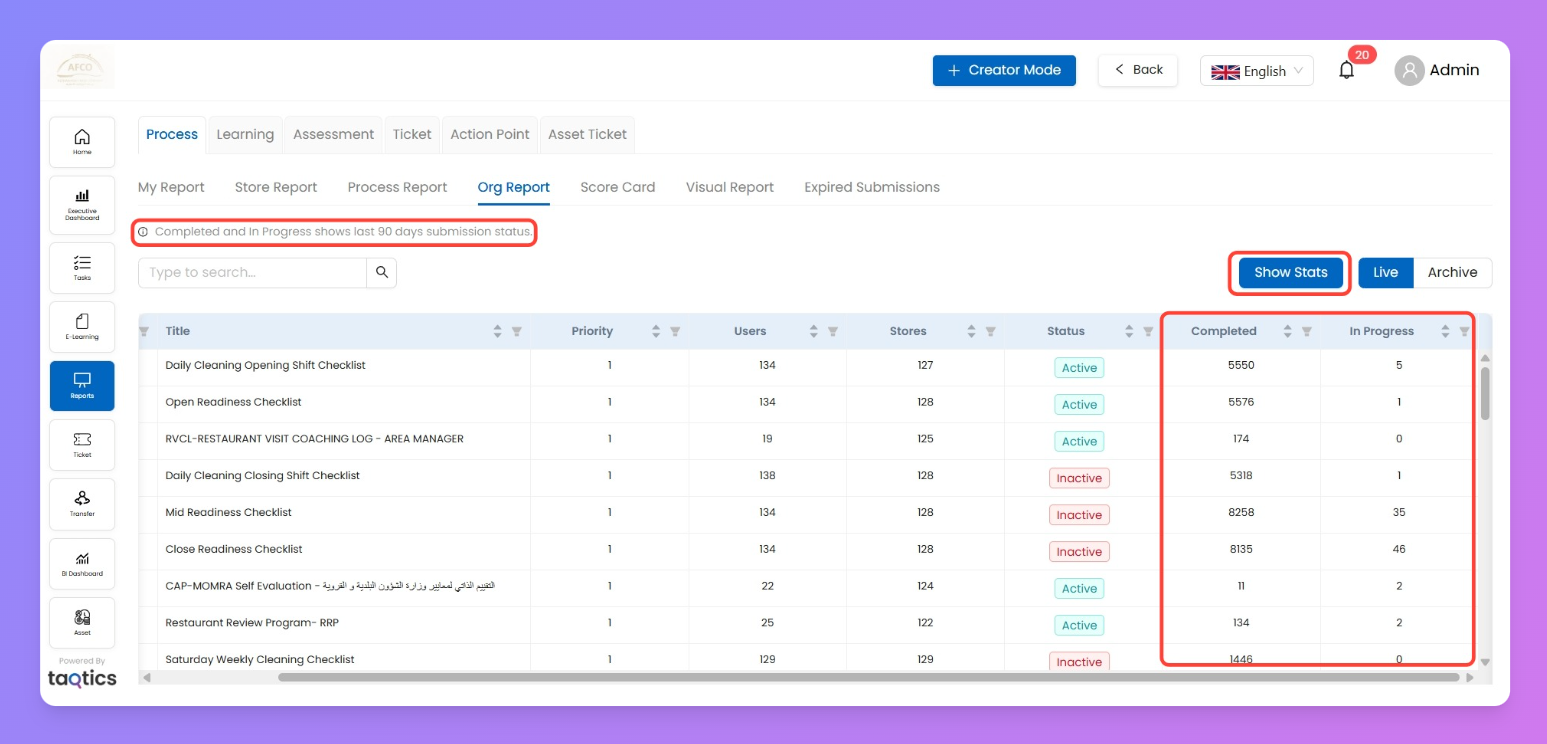
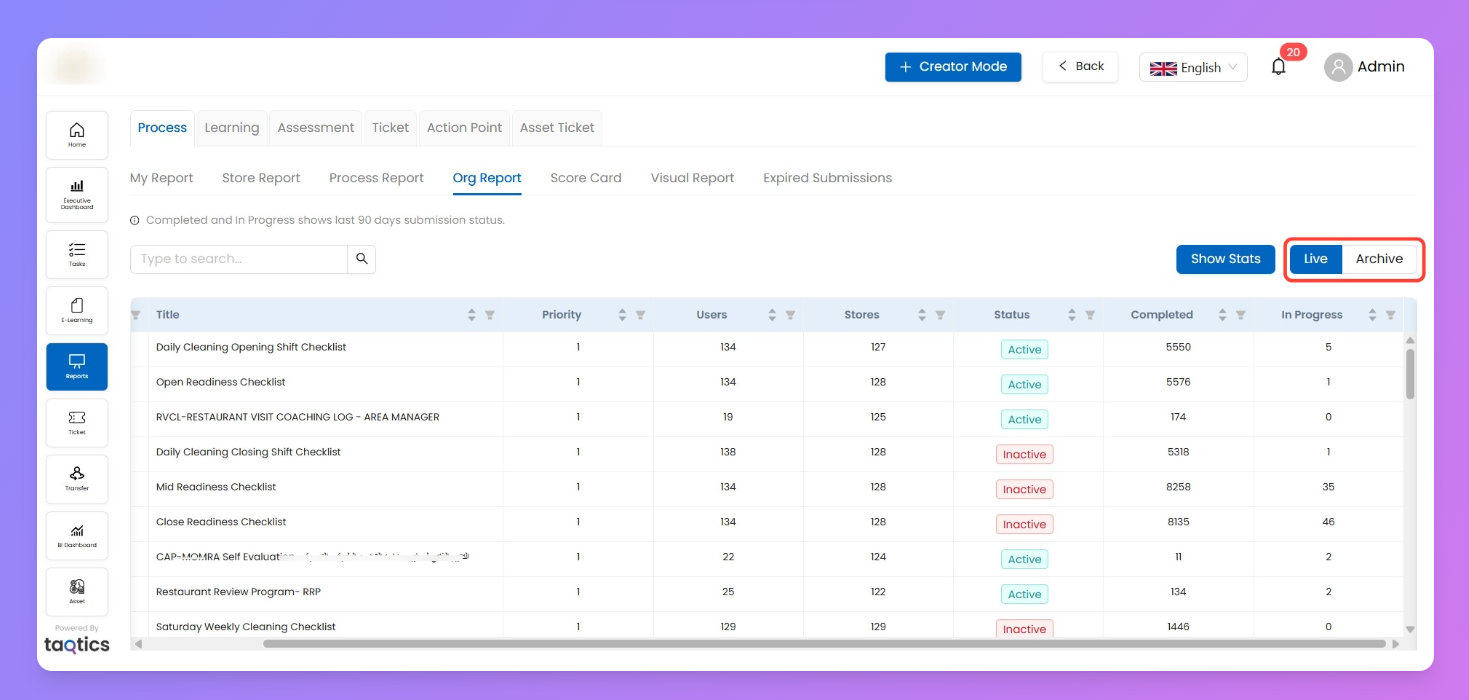
- Live / Archive toggle
- Live = forms currently active in the system.
- Archive = forms turned off from the system.
- This is separate from the “Active/Inactive” status column (which depends on checklist’s start/end time).
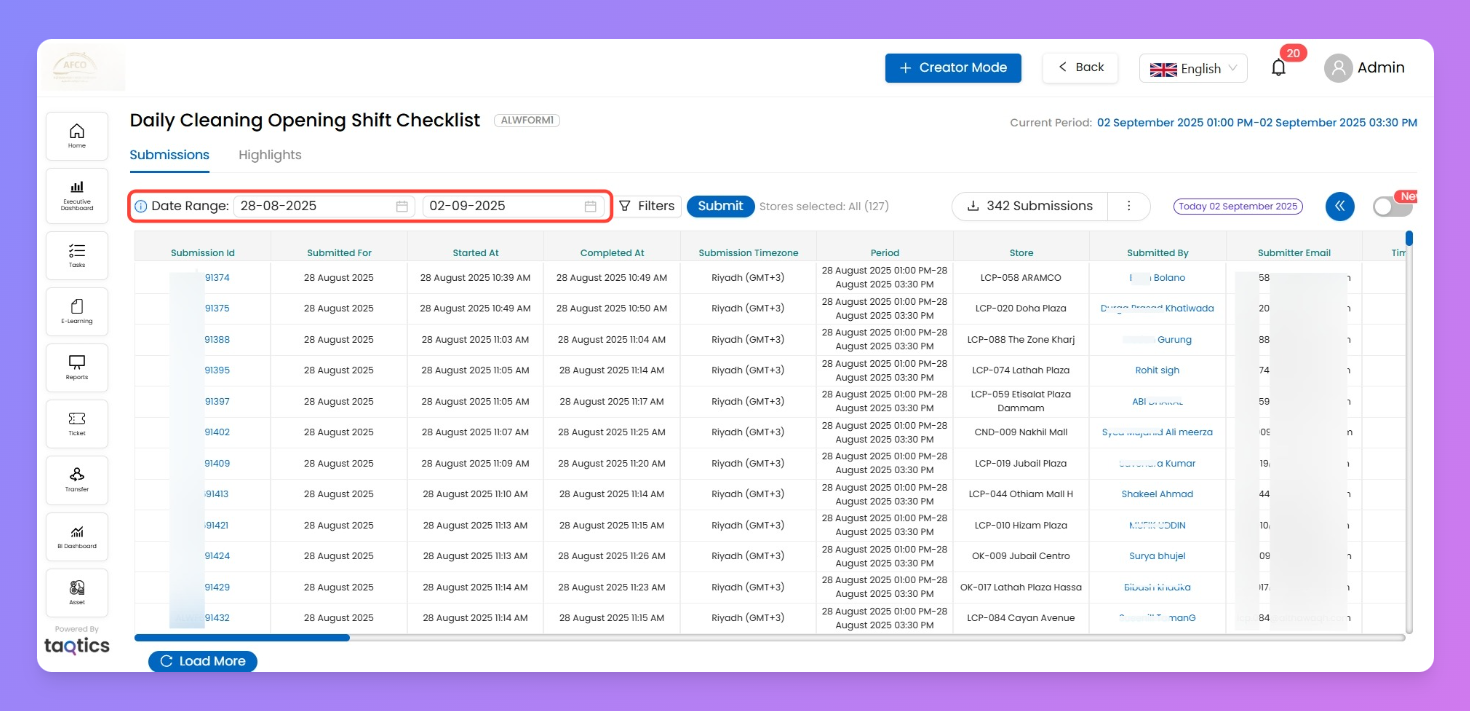
(I) Submissions (Drill-down -click a Form)
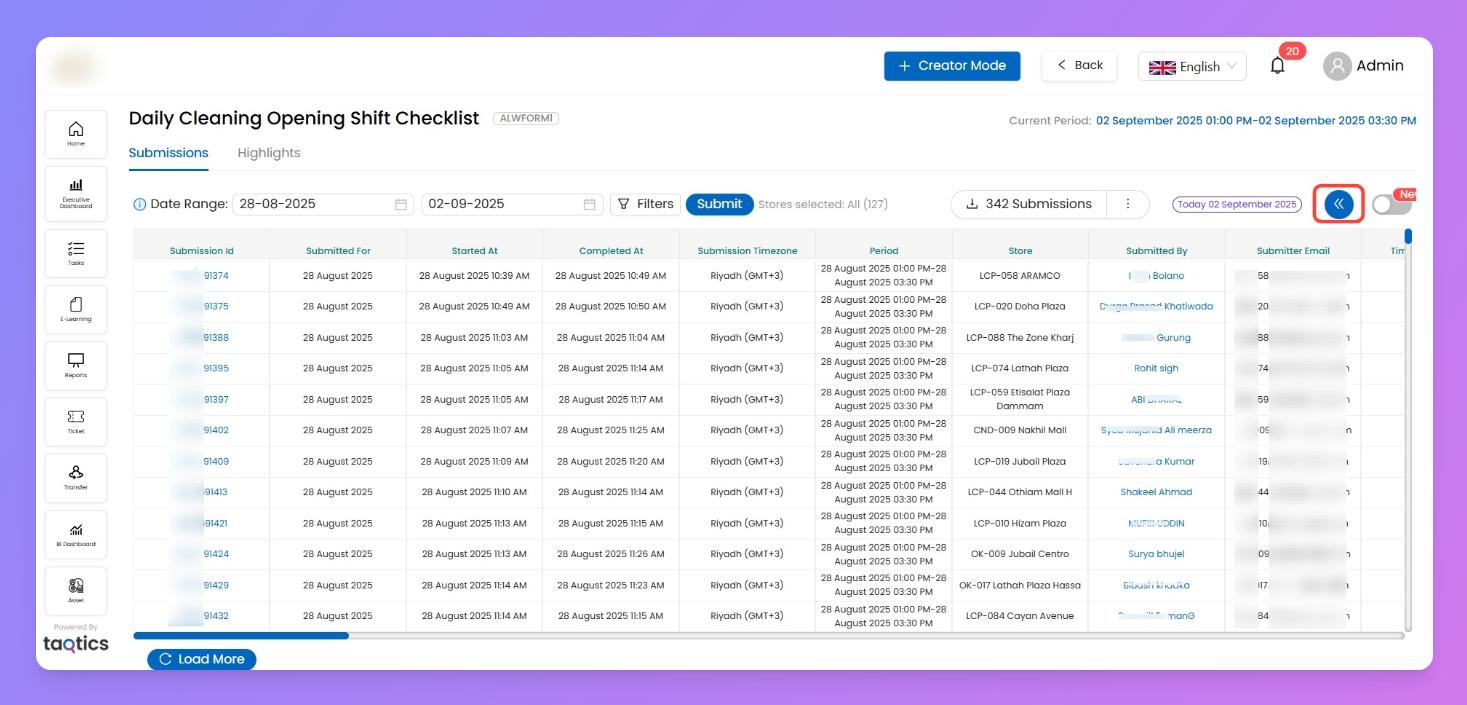
- Select a form → opens submission-level detail (e.g., Daily Cleaning Opening Shift Checklist).
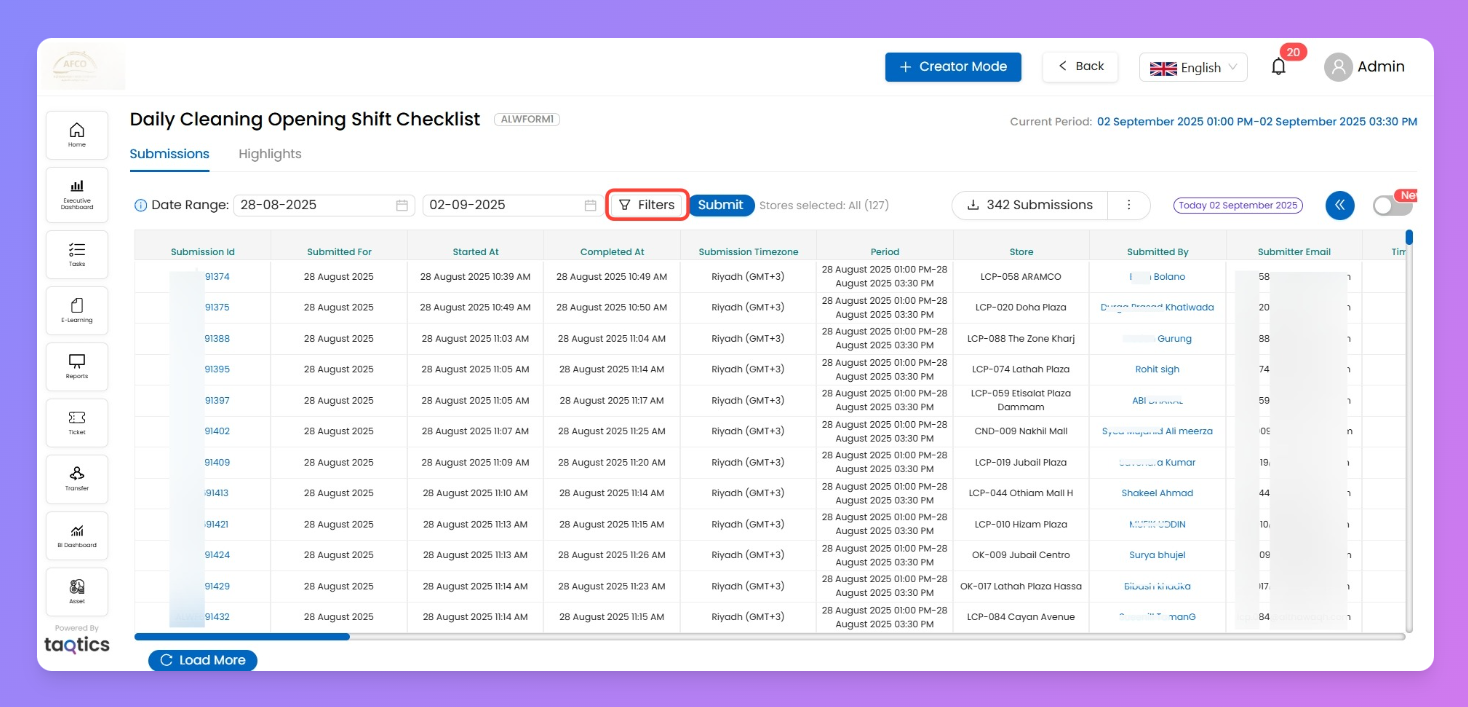
- Select Date range
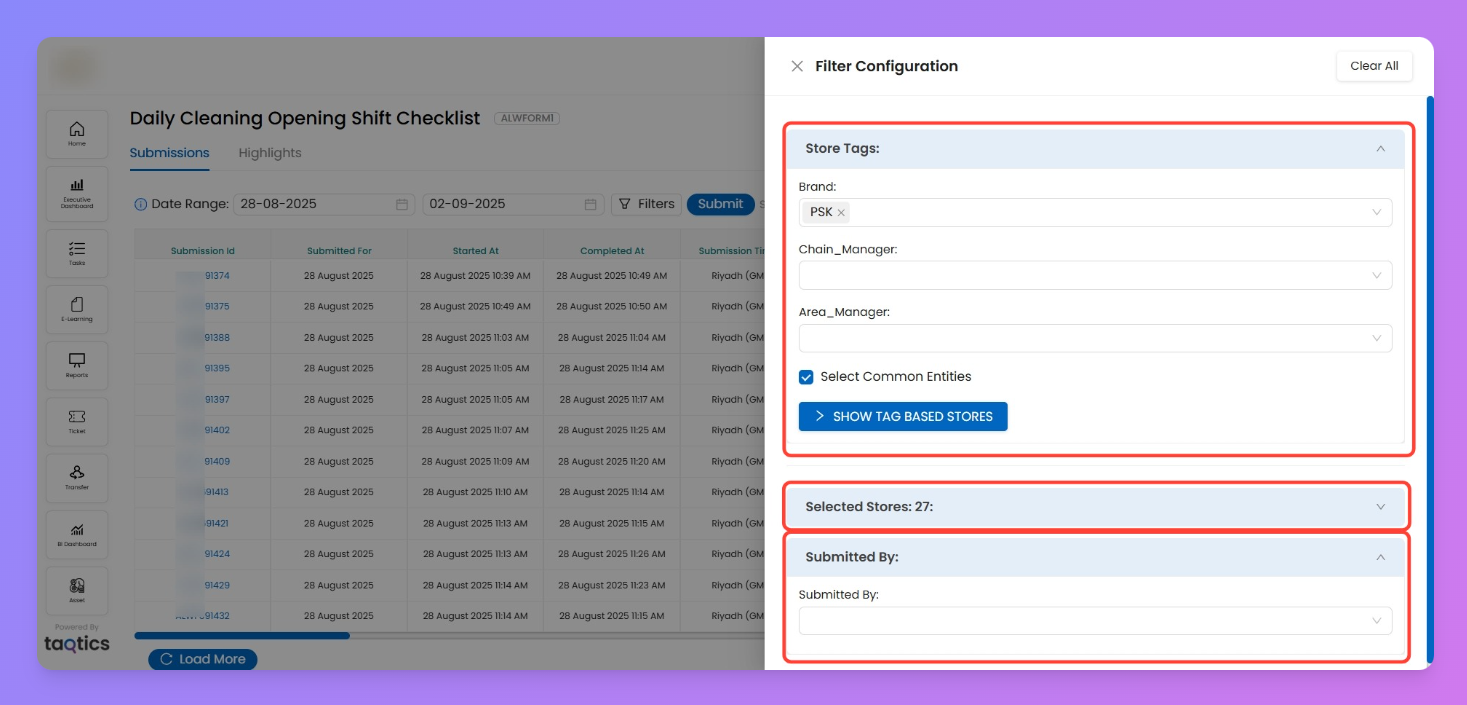
- Filters available:
- Store Tags
- See tags and choose their values from dropdown to select groups of stores inside them.
- Select Common Entities: Checking this box narrows the grid to only stores that are shared across all chosen tag values.
- Show Tag Based Stores: Click to instantly preview the stores matching your tag criteria; these then show in the Selected Stores below.
- See or manually add individual stores that were found by your tag filter—or select others directly. You always have control to refine the grid to only those stores you want even further.
- Pick and choose the submitters your want the report of.
Drill down by how stores are grouped in your system.
b. Selected Stores
c. Submitted By
- Grid view: Shows Submission ID, Submitted For, Store, Timestamps, Submitter name/email, etc.
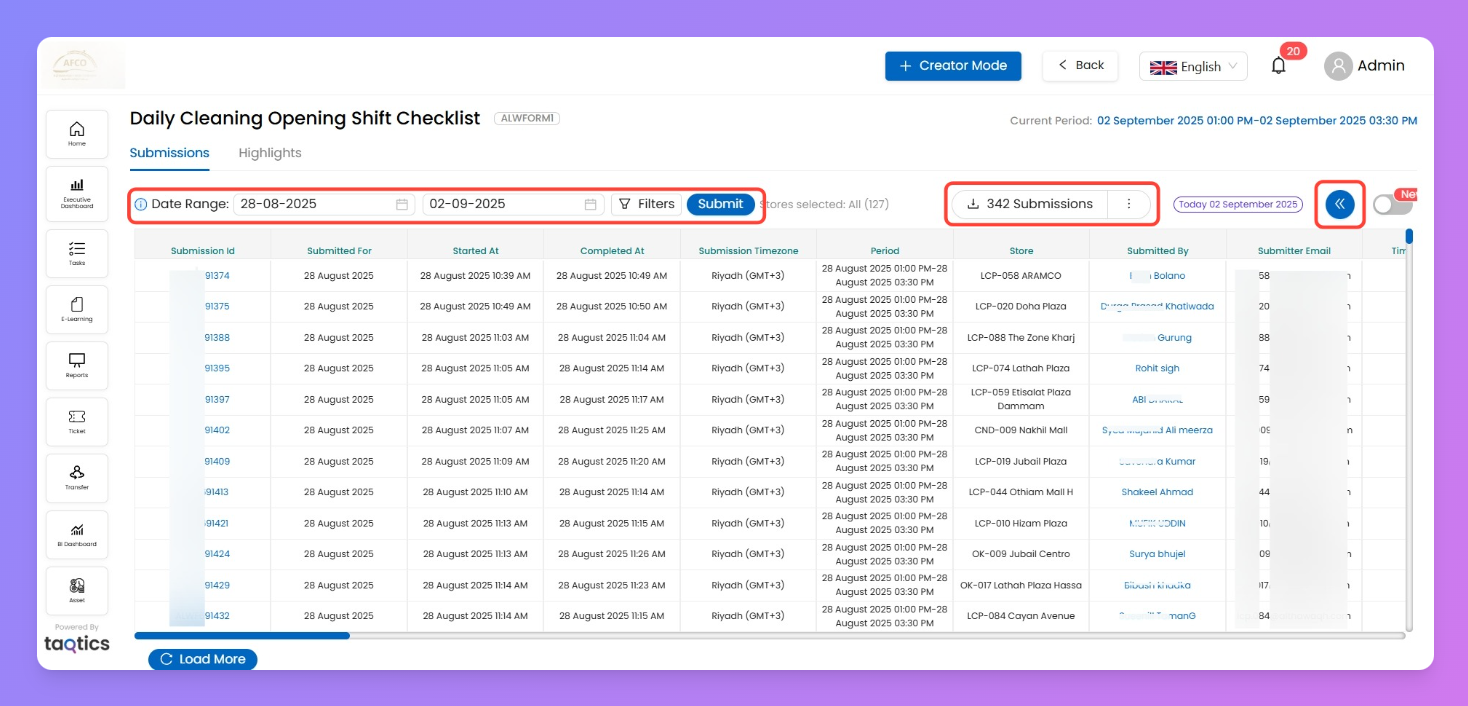
CSV Export & Monthly View
- Top-right button downloads all submissions and assignee visible.
- Download Assignee
- Top-right button → export list of all assignees for the checklist.
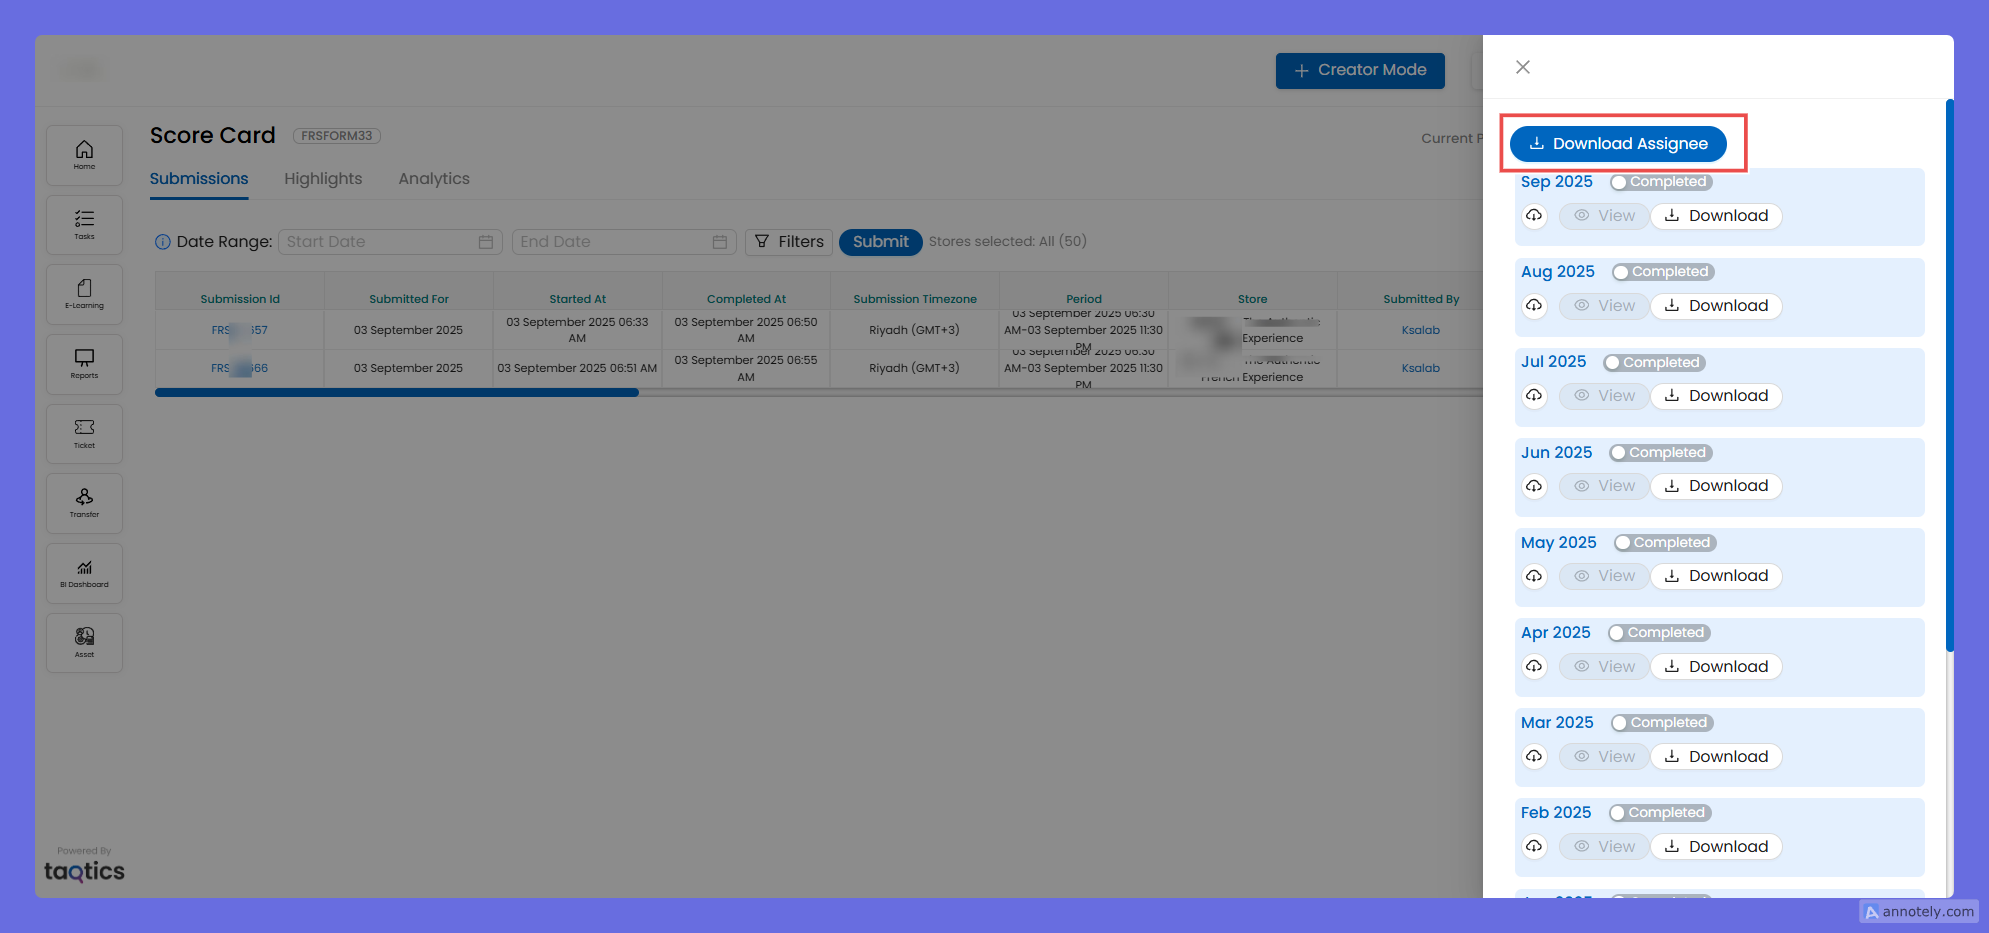
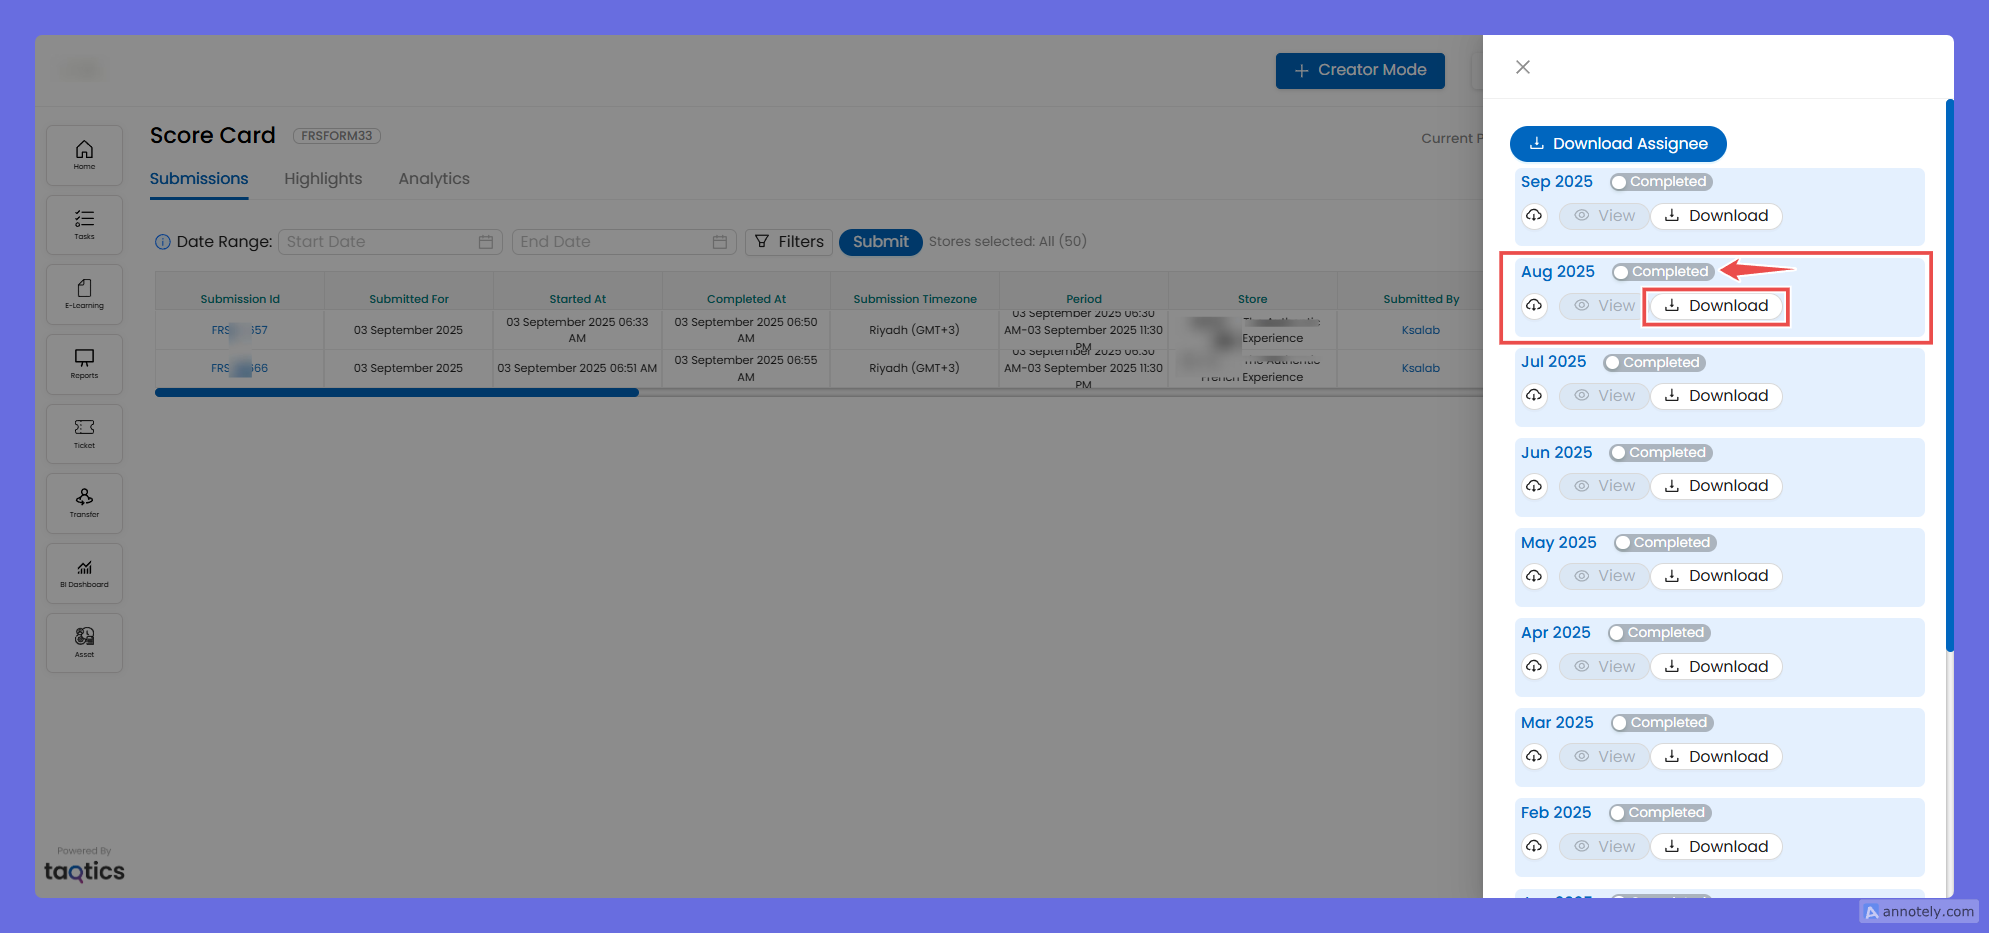
- Monthly CSV Dumps
- Right-side panel shows each month separately.
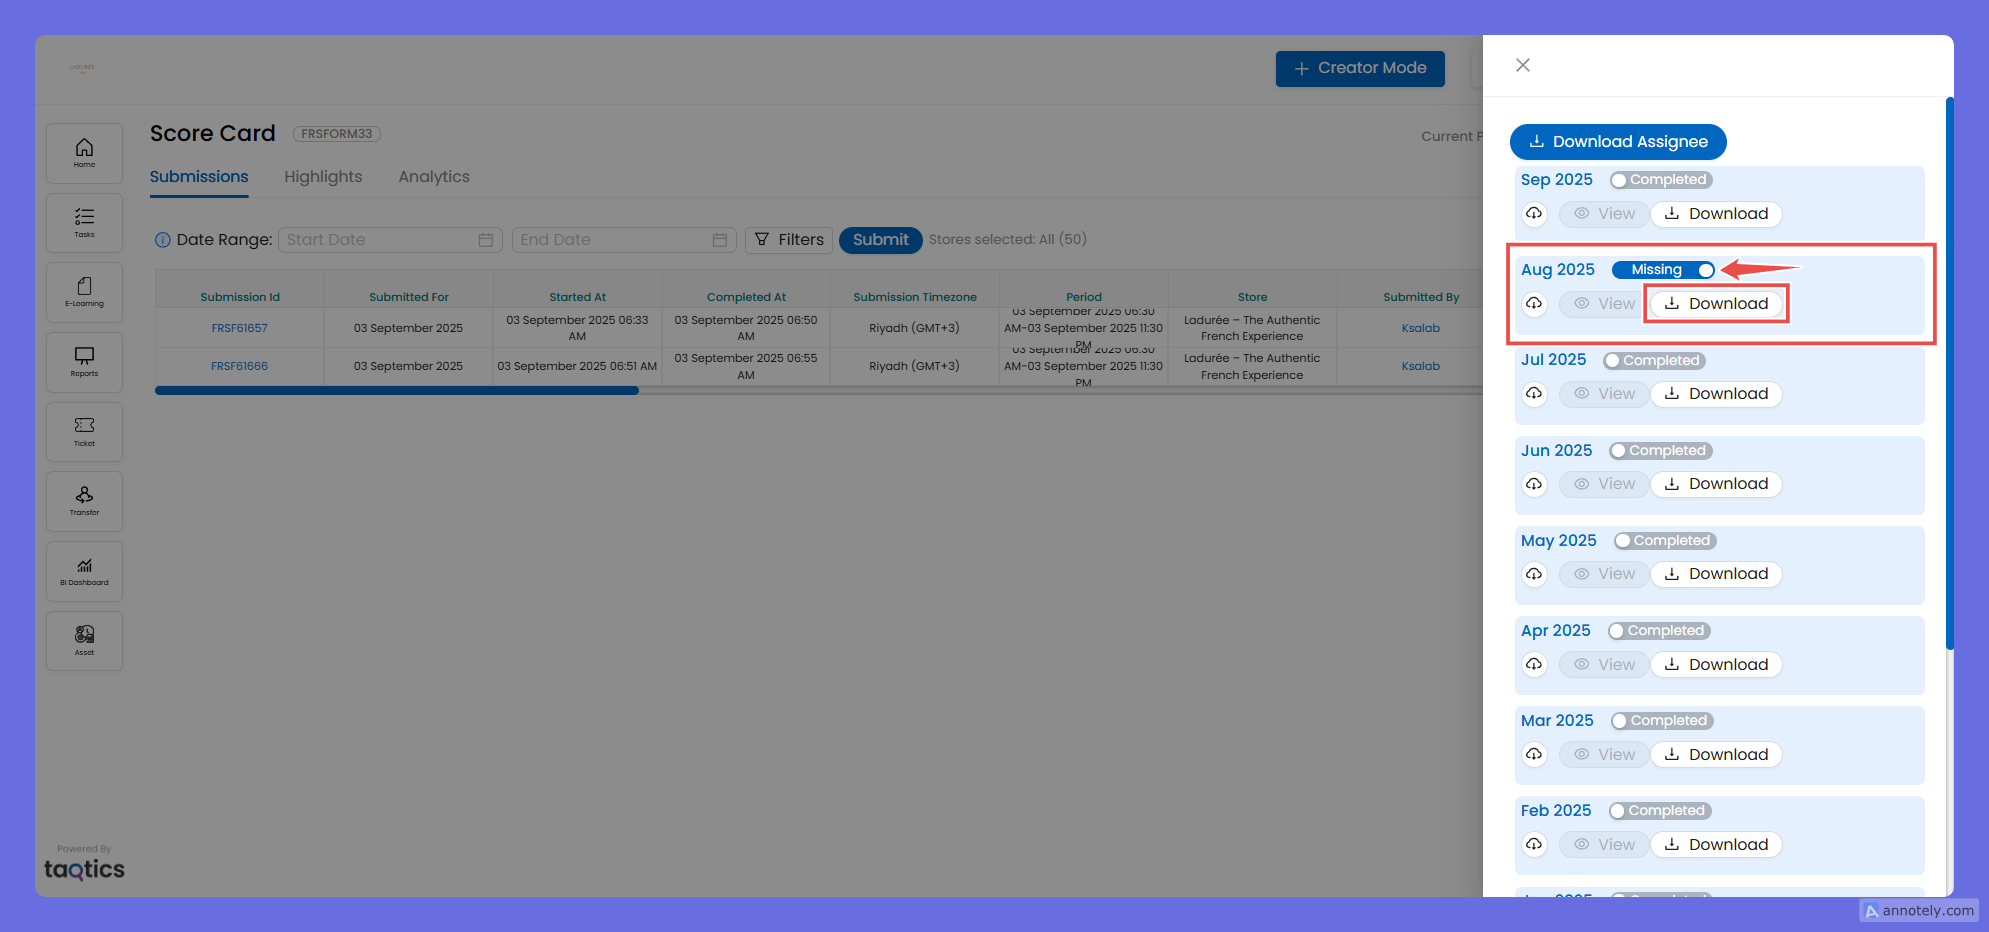
- Download CSV for Completed or Missing submissions (toggle between the two).
- Each CSV includes:
- System-generated fields
- All checklist/process questions
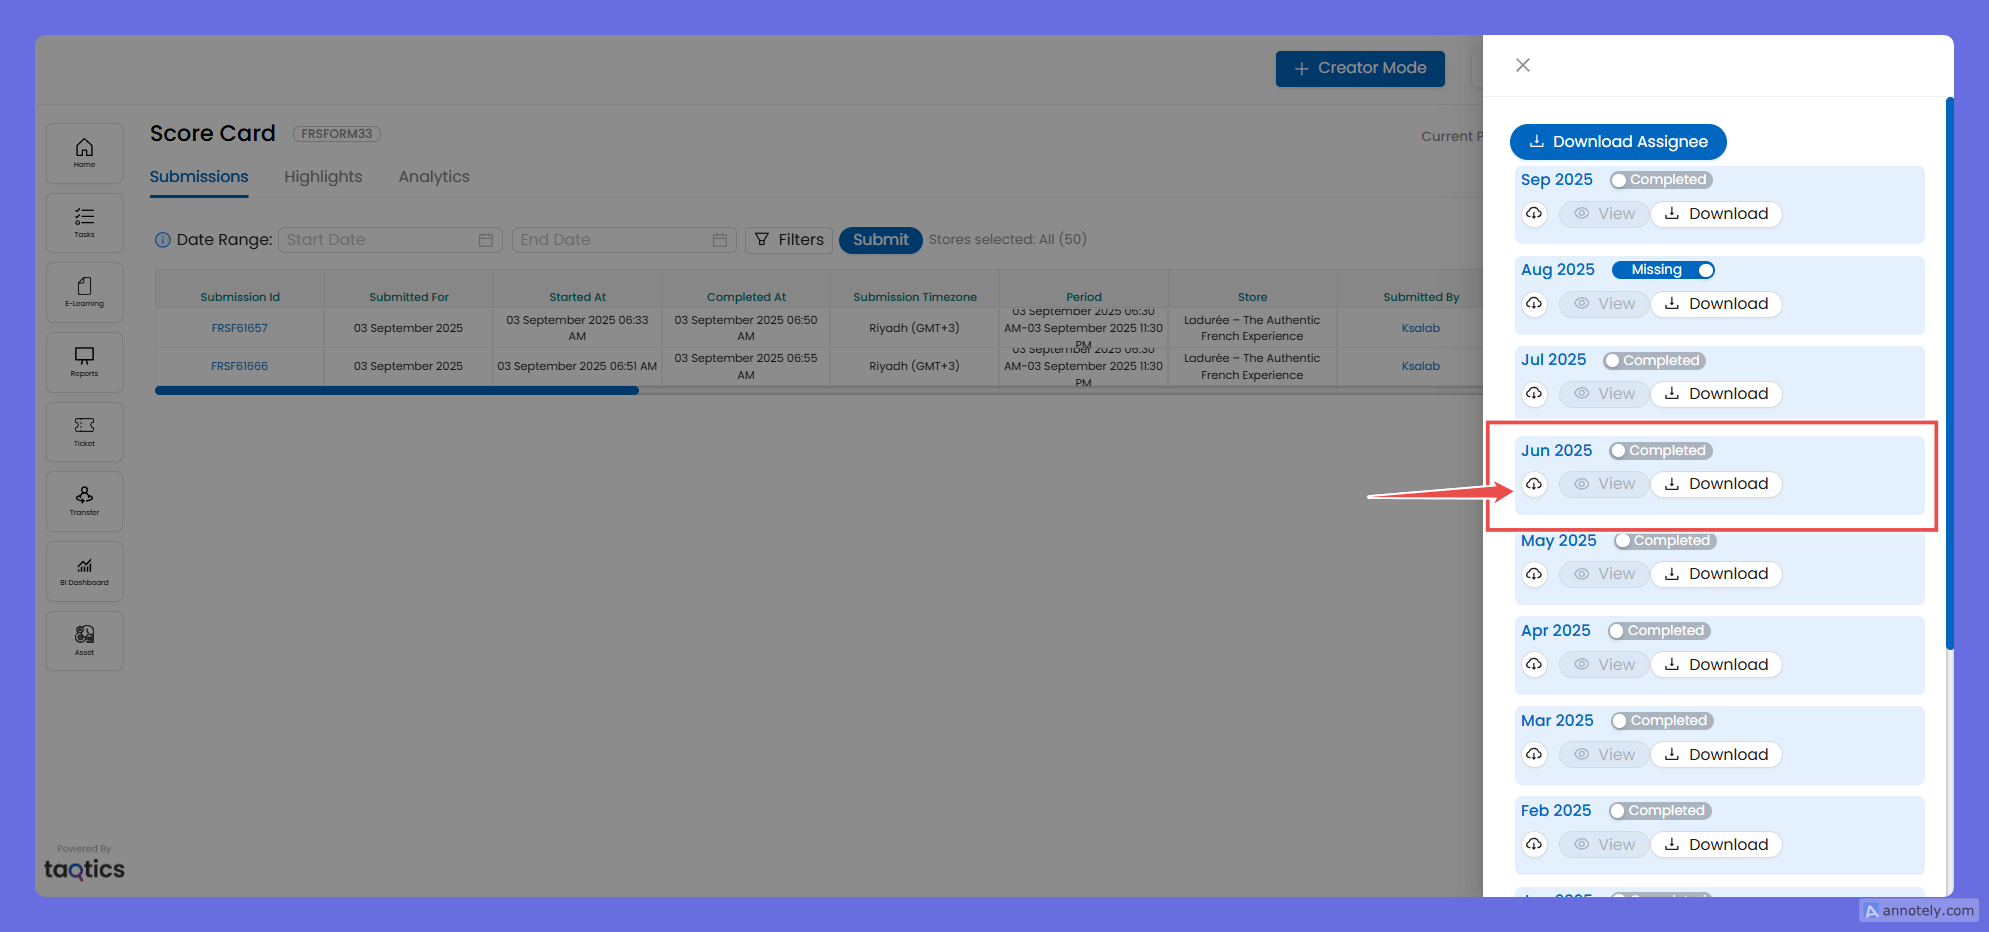
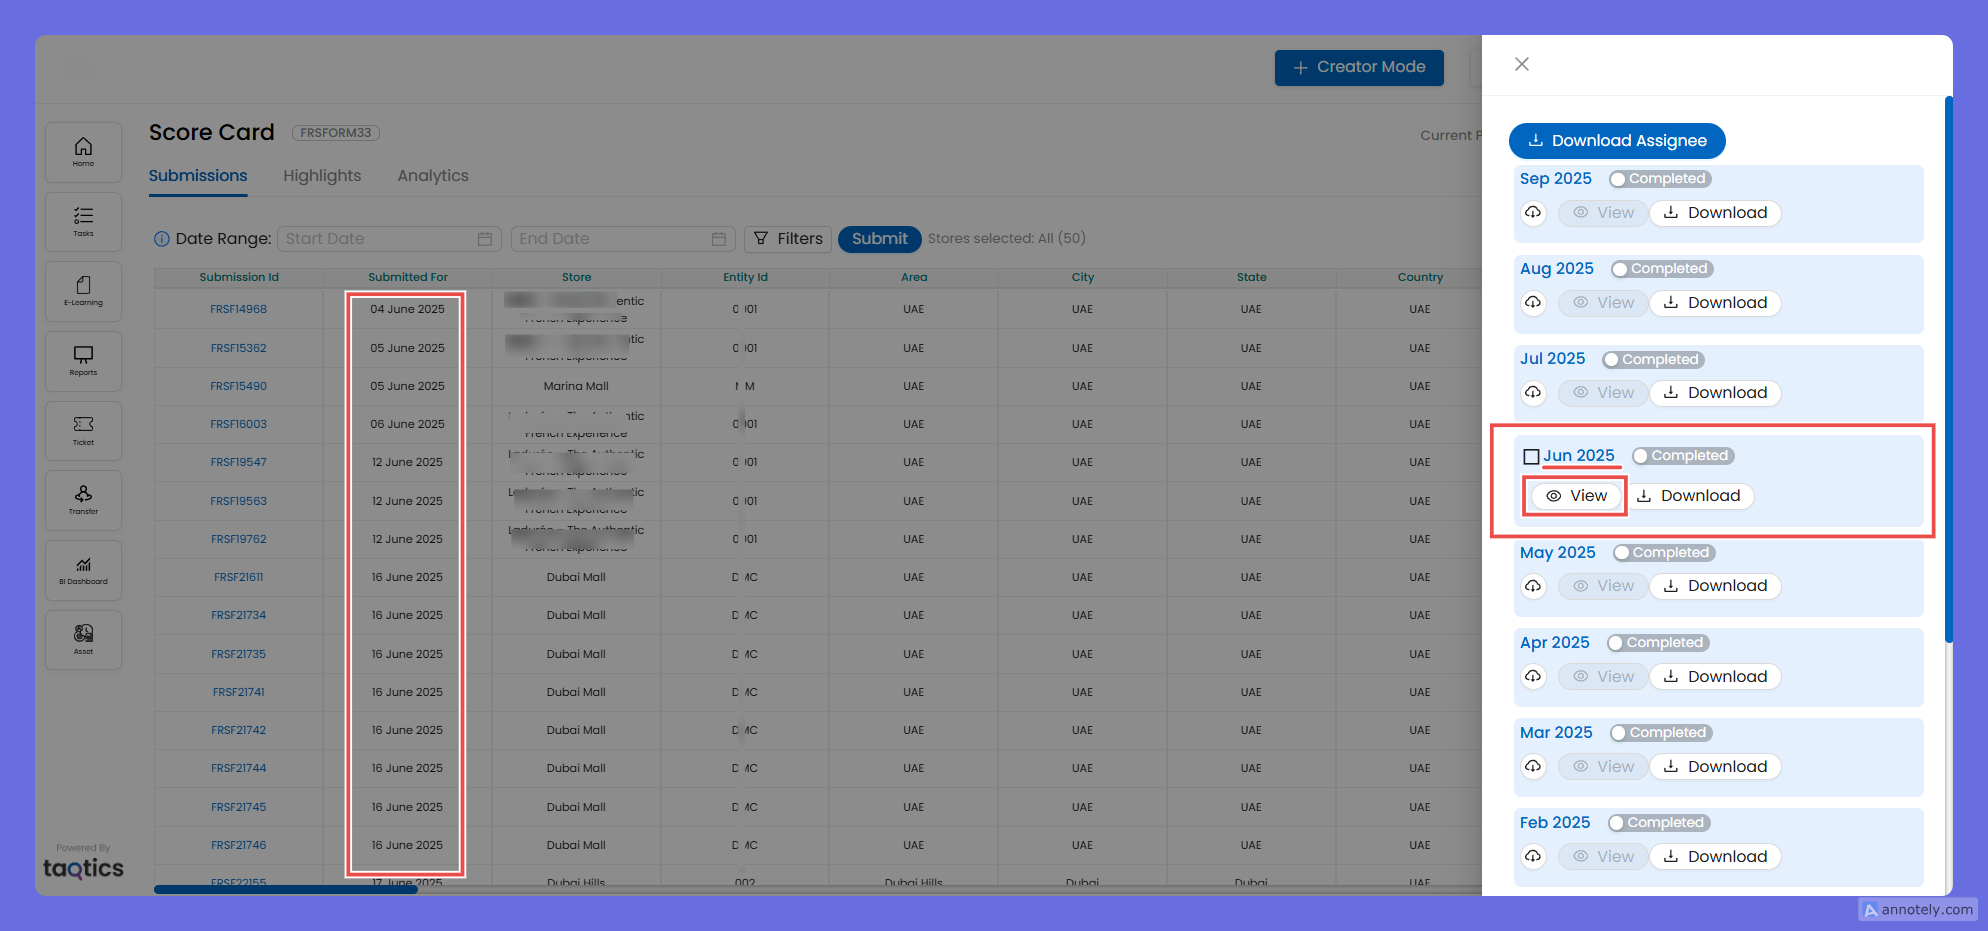
- View Data in Grid
- Small checkbox → activates the View option for that month.
- Clicking View → shows all submissions of that month directly on the grid (no CSV download required).
Purpose
- Provides centralized data visibility across the entire org.
- Best for bulk export/dumps into external systems for insights, reporting, or archival.
- Ideal for higher-level roles to track both live and historical process activity.
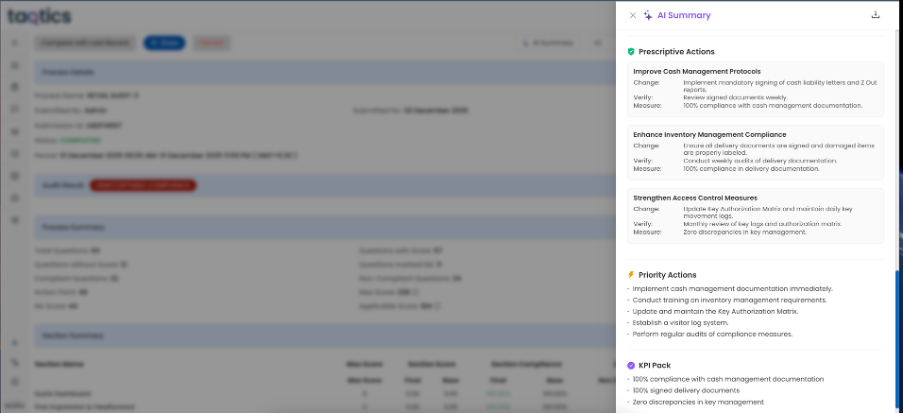
🔹 SUBMISSON REPORT: AI-Based Risk Summary for Audits & Processes
AI-generated risk summaries can now be displayed in Reports.
(Available only for tenants with AI activated)
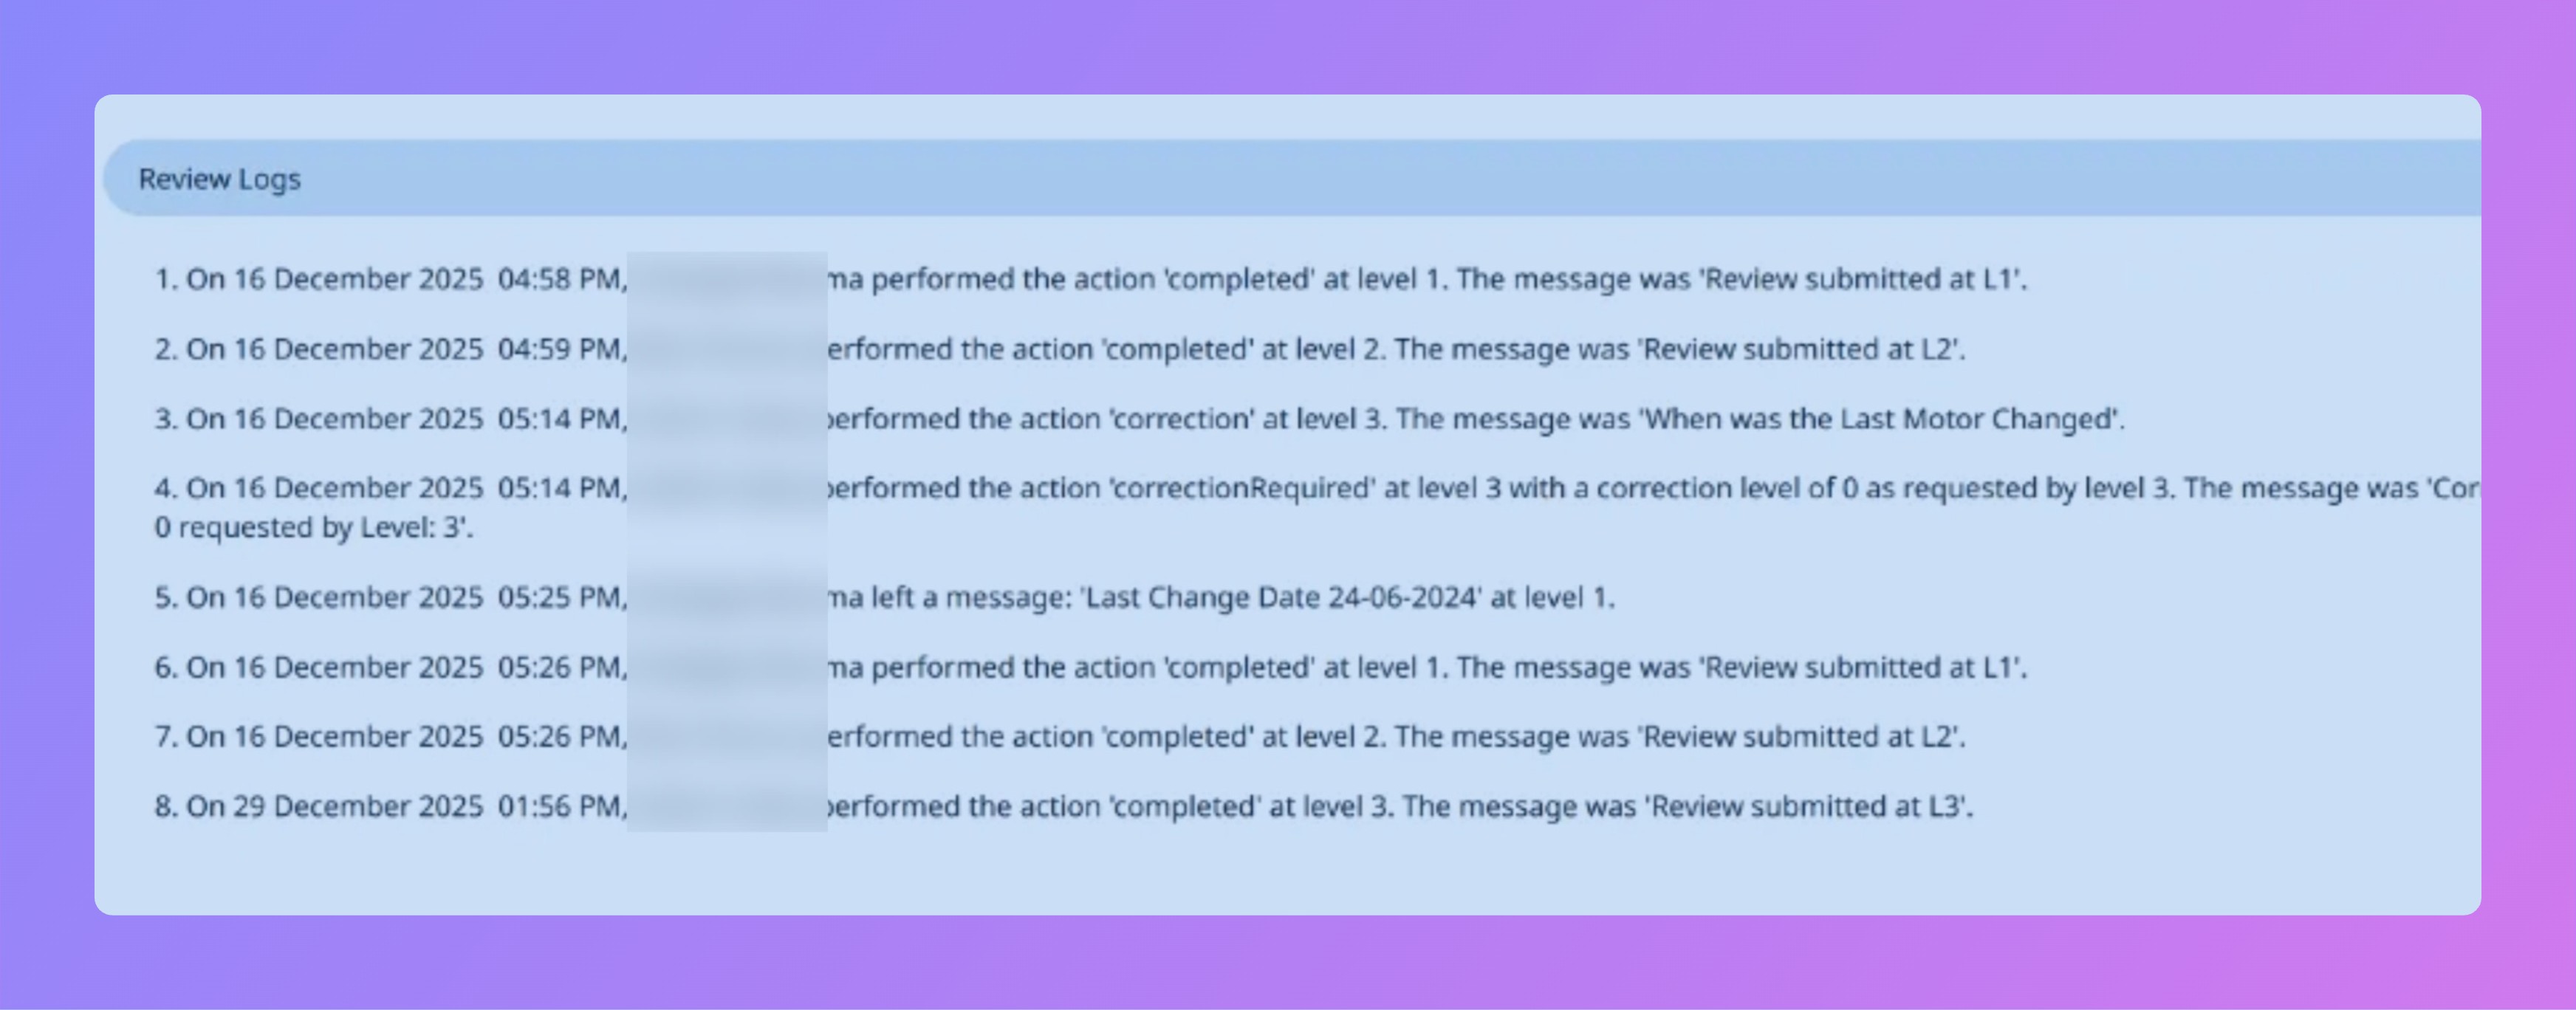
🔹 Review Comments in Reports & PDFs
Reviewer comments are now visible as structured Event Logs in:
- Submission Reports
- PDF Exports
- Visual Reports PPT
(II) Highlights
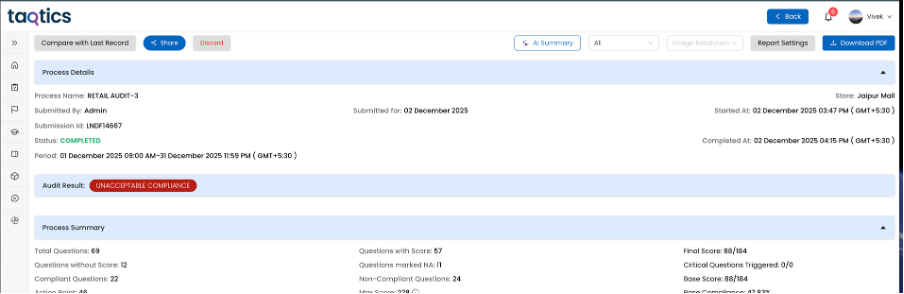
Once you click into any process from the Org Report grid, the Highlights tab gives you a quick snapshot of overall performance and properties of that process.
Process Properties
- Shown at the top of the page for the selected process.
- Includes:
- Frequency (e.g., Daily, Weekly, Monthly)
- Date Selection (Allowed / Not Allowed)
- Multiple Submissions (Allowed / Not Allowed)
- After Cutoff (Allowed / Not Allowed)
- Assigned Stores & Users
- Average Compliance %
- Total Submissions
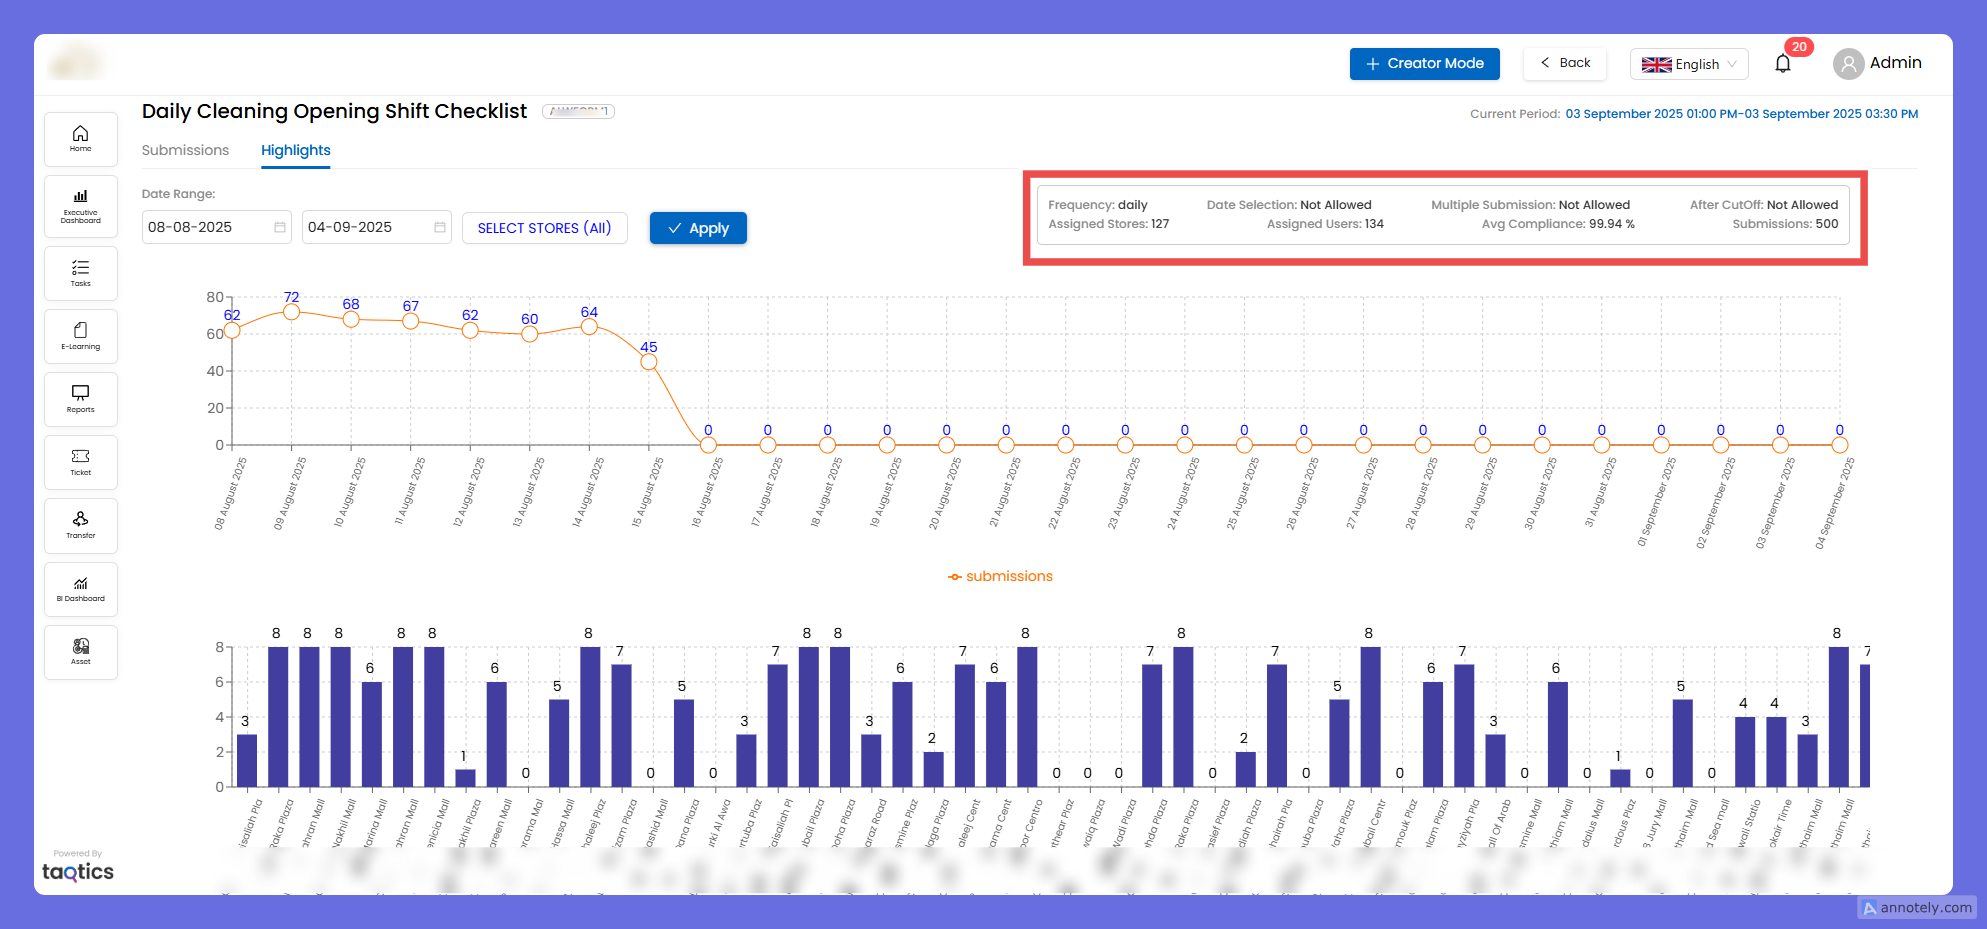
Filters
- Date Range → Select a custom range to view submissions.
- Store Filter → Choose specific stores or “All” to compare.
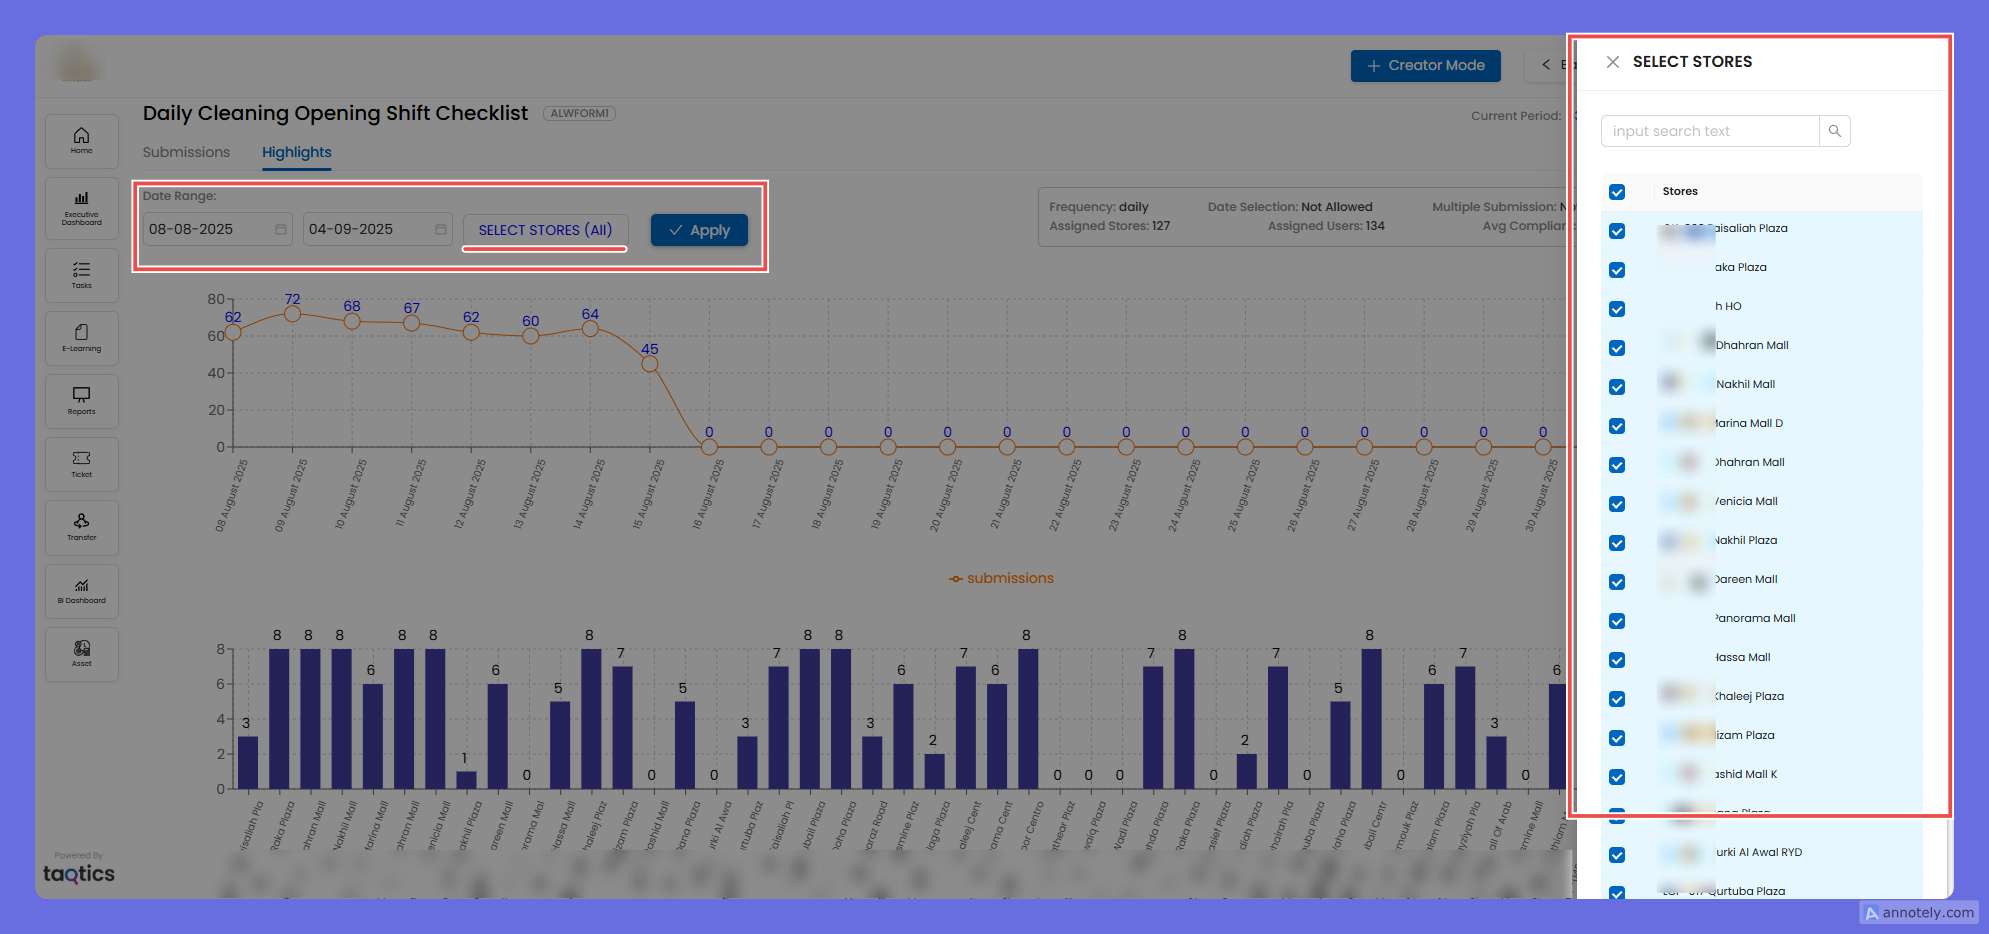
Visuals
- Line Graph (Top) → Tracks total submissions over the selected date range.
- Bar Graph (Bottom) → Shows submission counts store-by-store.
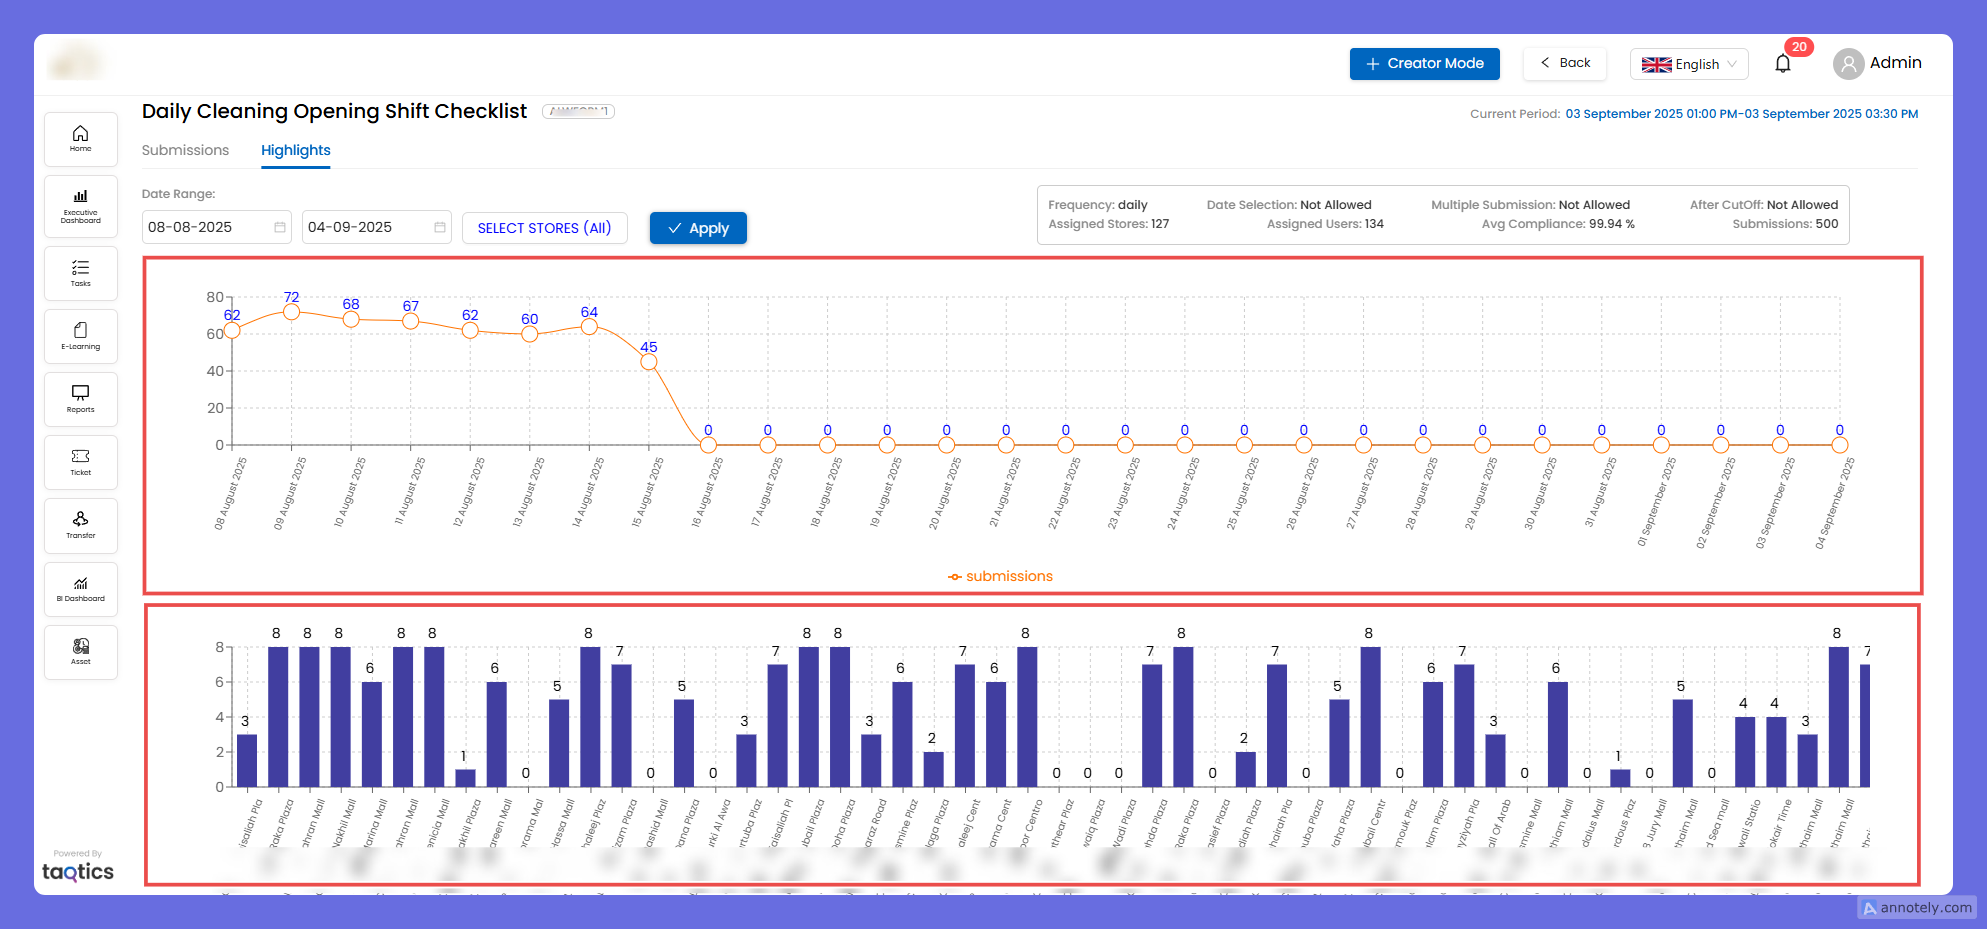
➡️ Together, these give both a time-based view (daily trends) and a location-based view (per store).