
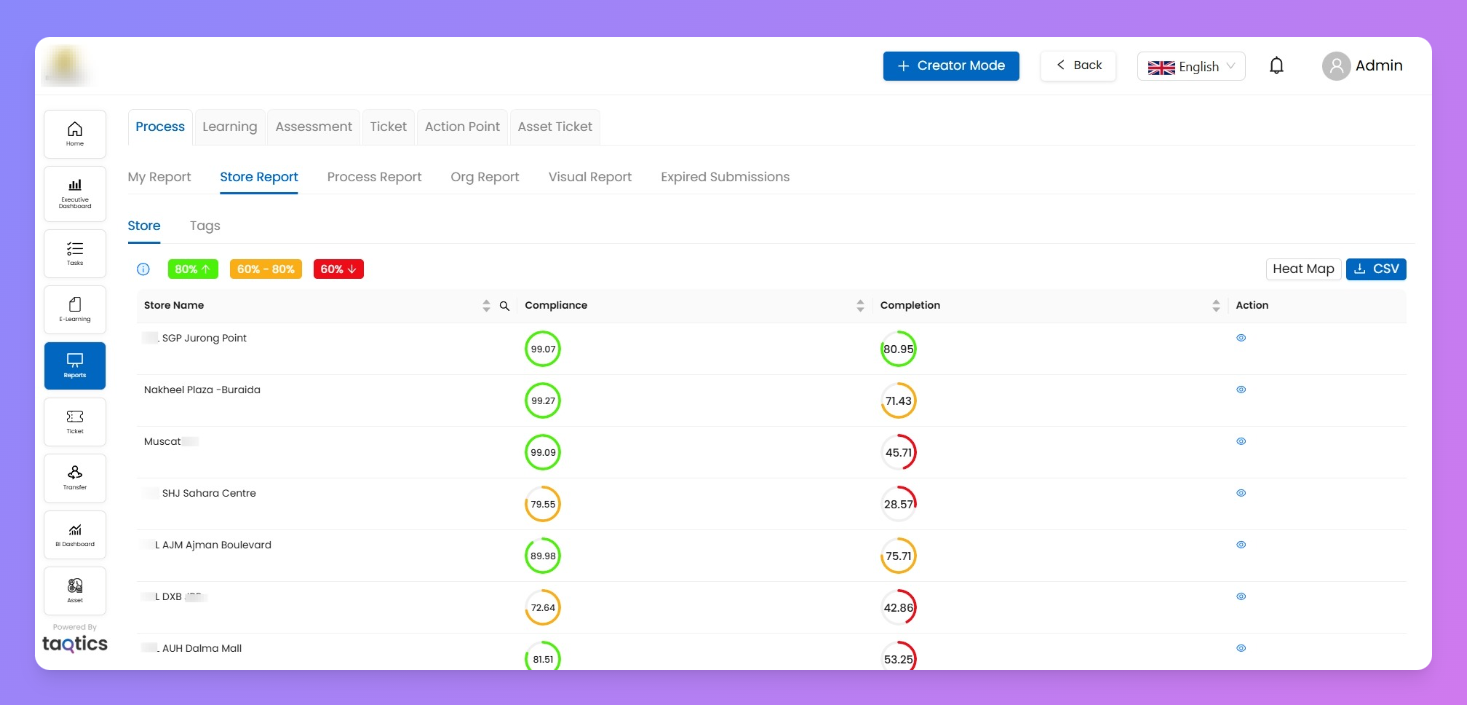
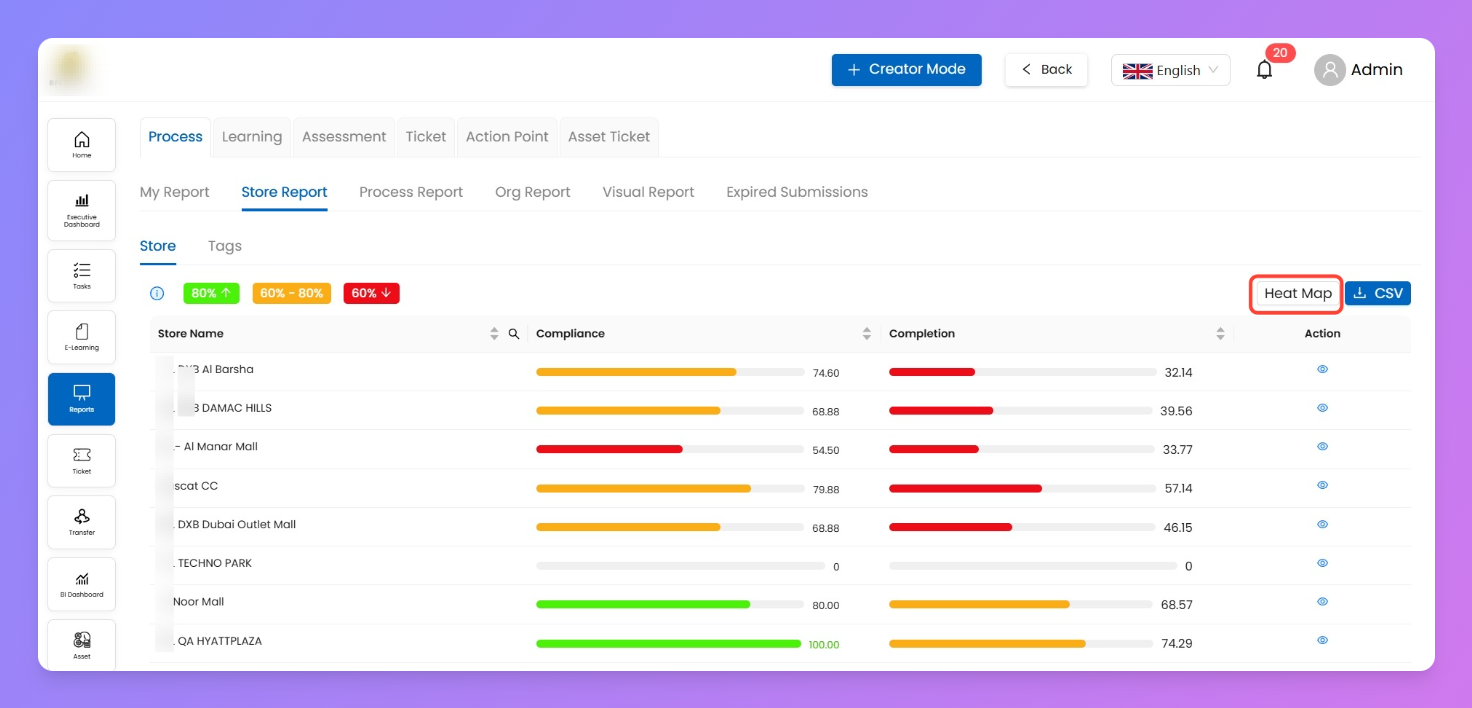
Store Report
The Store Report gives you a grouped view of how each store is performing on compliance and completion across all assigned processes, audits, or workflows.
It gives a grouped view of compliance and completion across stores. It’s split into two tabs — Store and Tags — each offering its own way to drill down into performance.
Store Tab
- Open Reports > Store Report.
- You’ll see a grid with all listed stores.
- Columns show:
- Store Name
- Compliance % (quality of submissions)
- Completion % (how many were actually submitted)
- Colored bands (Green, Amber, Red) indicate thresholds. (you can change this from Heat Map)
- CSV export available.
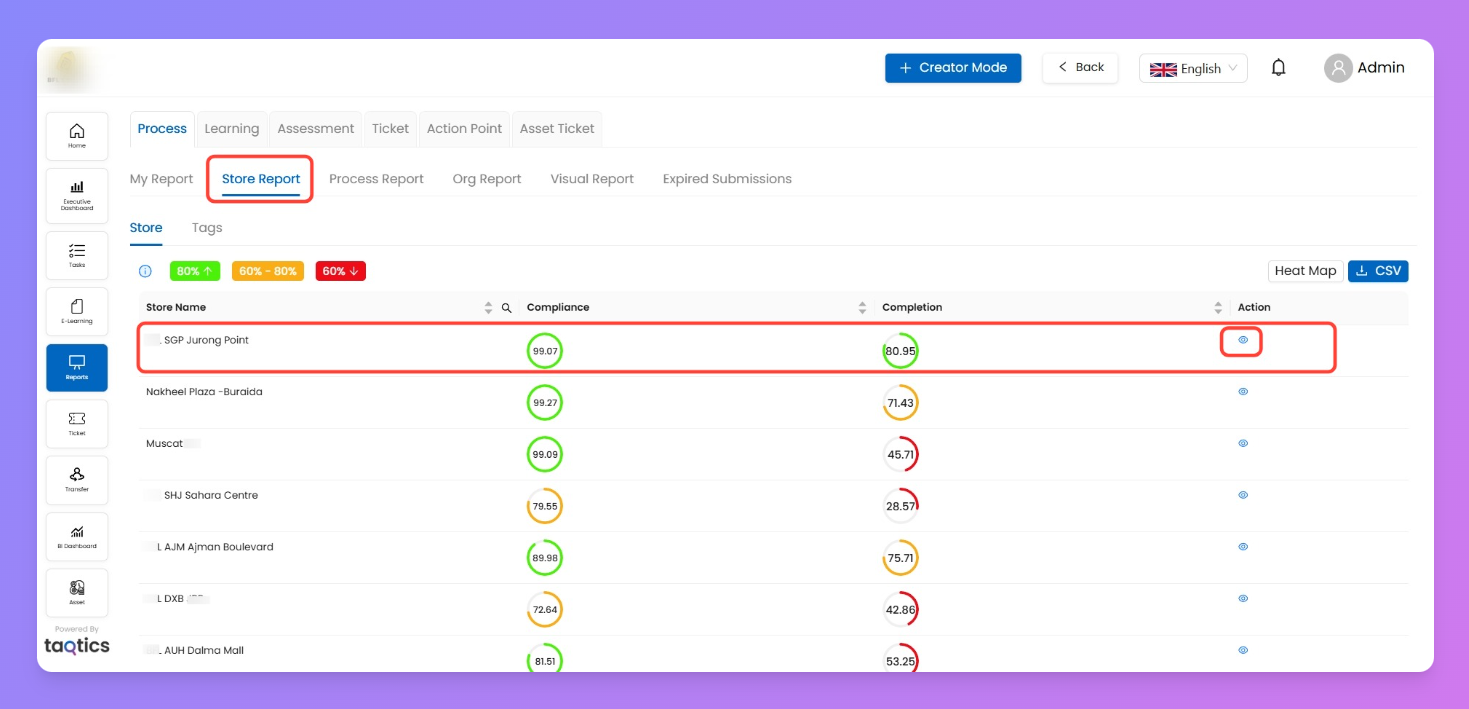
👉 Use the eye icon under Action to drill into a specific store.
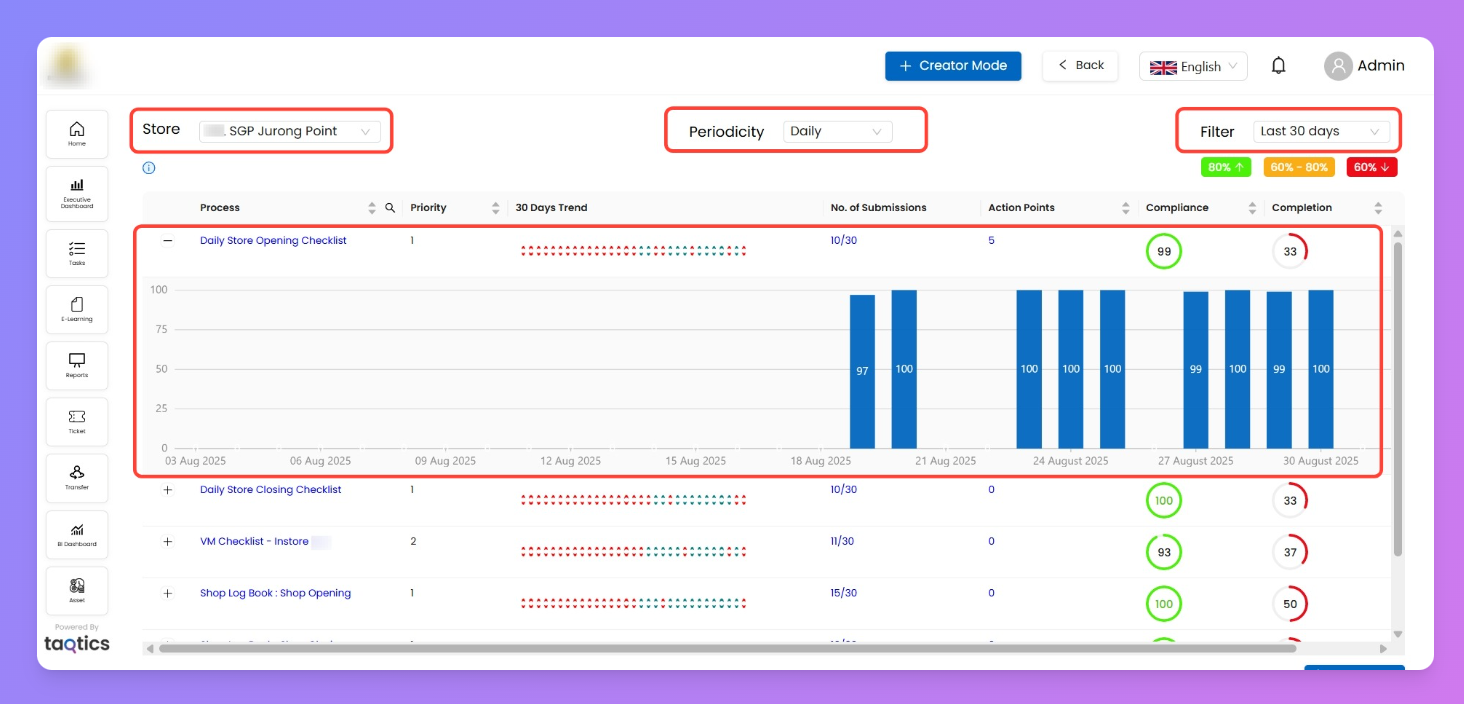
Step 1: Store Drill-down
- Select a store → view all processes/audits assigned to it.
- Columns include:
- Process Title
- Priority
- 30 Days Trend (If last 30 Days is selected from Filter)
- # of Submissions
- Action Points
- Compliance & Completion %
- Click the “+” next to a process to expand → shows blue bar graphs of submission compliance over Periodicity Selected.
- Top filters let you adjust by:
- Store
- Periodicity (Daily / Weekly / Monthly)
- Date range (Last 30 days, custom, etc).
Click a process name → go to detailed submission Workflow level reports.
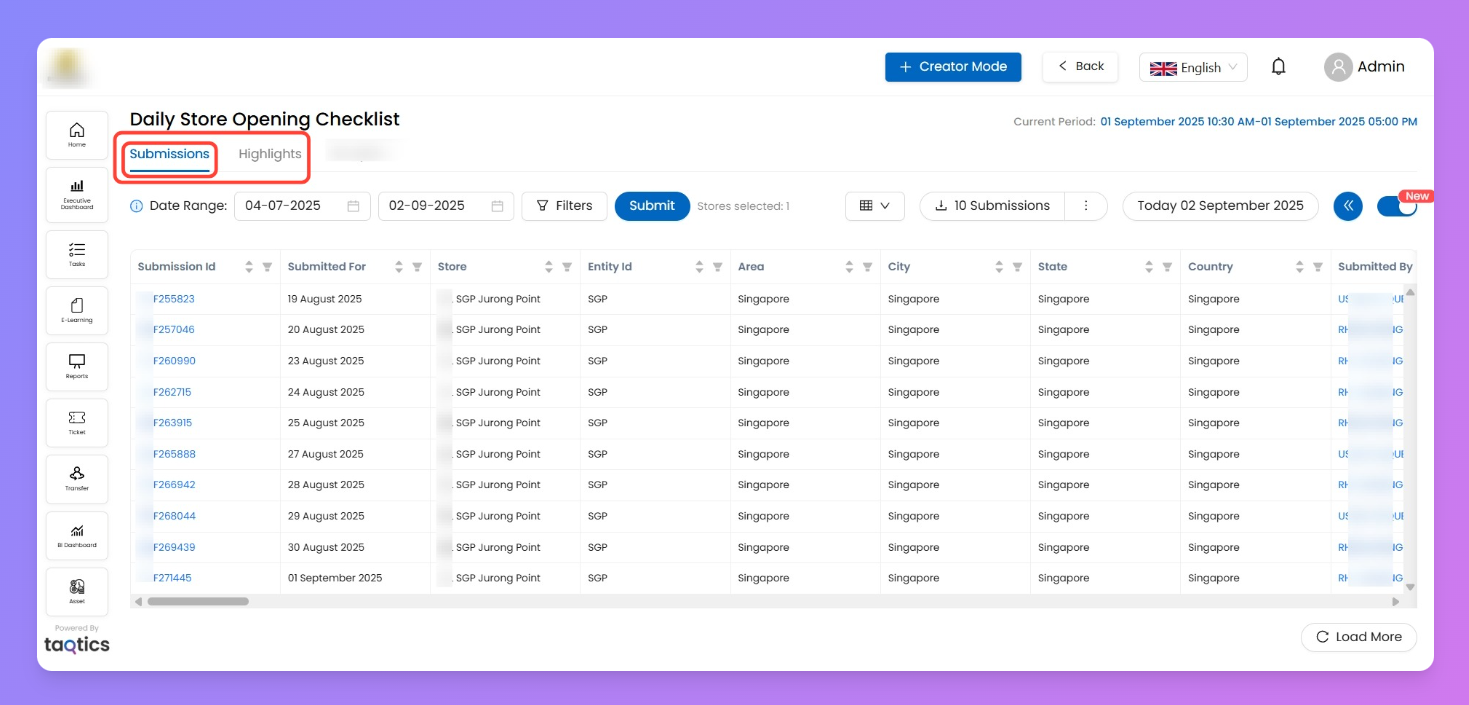
Step 2: Process-Level Detail
- Click on a process title to go deeper.
- Tabs available:
- Submissions → Grid of all submissions with filters for date and User + CSV download.
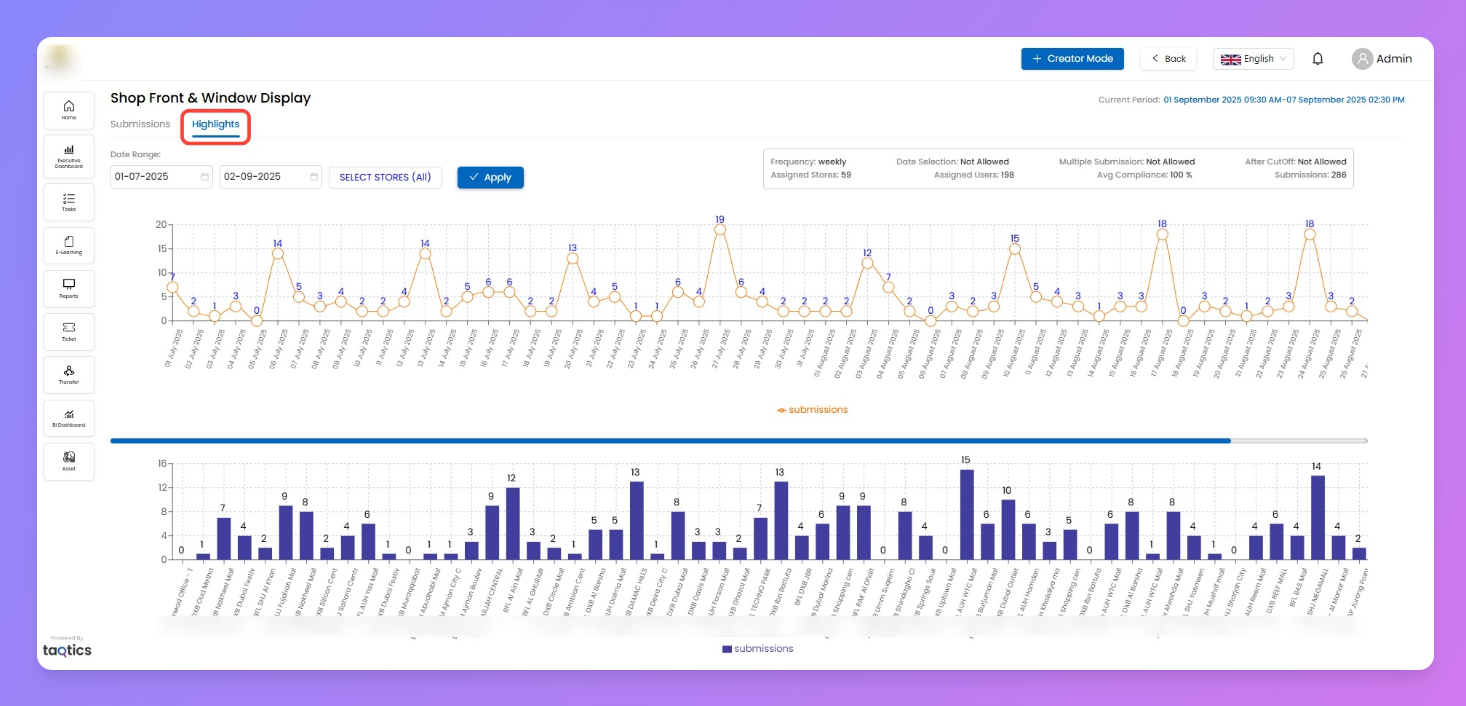
- Highlights → Graphs showing trends.
- Graph 1: Time (X-axis) vs Submissions (how many per day/week/month).
- Graph 2: Stores (X-axis) vs Number of submissions.
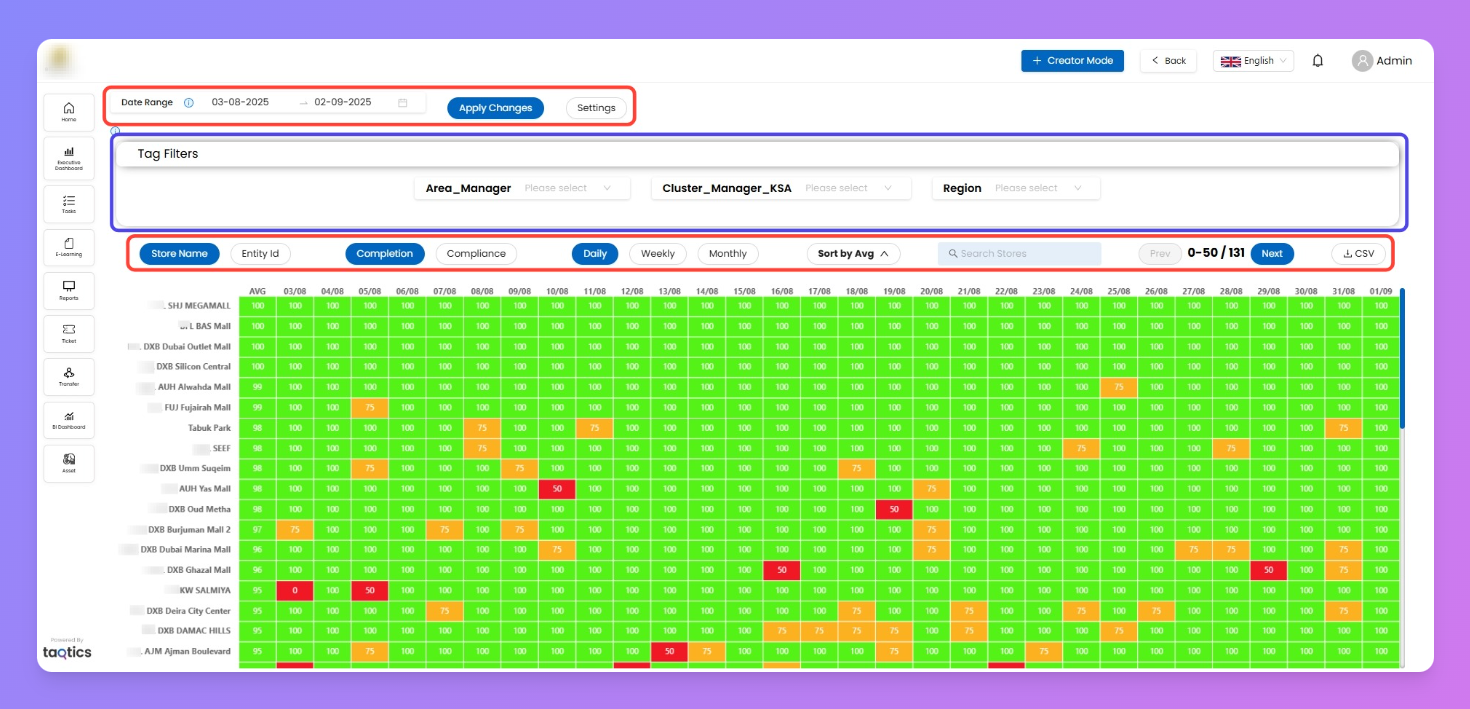
Heat Map
- Opens a color-coded grid of store performance over time.
- Y - axis = Stores | X - axis = Dates (daily, weekly, or monthly based on periodicity).
- Each cell shows Completion/Compliance % with color bands:
- Green = High performance
- Amber = Medium performance
- Red = Needs attention
- Filters available:
- Date Range (start & end date)
- Store / Entity ID
- Tags (e.g., Brand, Area Manager)
- Periodicity toggle (Daily / Weekly / Monthly)
- Metric toggle (Completion / Compliance)
- Sort by average performance
- Settings option:
- Adjust thresholds for Green/Amber/Red bands (e.g., >80% = green).
Changes apply across Store Report + Heat Map.
- Drill-down flow:
- Click a cell → view assigned processes/audits for that store + date.
- Tap into a process → full submissions report.
- CSV download supported.
Tags Drill-down
- Groups compliance and completion by Store Tags instead of individual stores.
- First view shows all tags (e.g., Brand, Area Manager, Chain Manager).
- Drill path:
- Click eye icon on a tag → view all tag values (e.g., all brands).
- Each tag value shows its Compliance % and Completion %.
- Click into a tag value → see all stores under that tag, with their scores.
- CSV export available at each level.
How it Helps
- Quickly compare store-level compliance and completion.
- Spot underperforming stores using the red/yellow/green indicators.
- Drill into processes to see submission patterns and workload distribution.
- Export data as CSV for deeper offline analysis.